The data and analysis are for 2025 and, therefore, do not reflect the impacts of conflict in the Middle East on Western Australia’s (WA) resources sector. The conflict has already affected commodity prices and operating costs (from higher diesel, jet fuel, and chemical prices), leading to impacts on industry activity. The size of the impact remains dependent on the length, extent, and intensity of the conflict, which is highly uncertain.
WA’s resources sector made a significant contribution to the State’s economy in 2025:
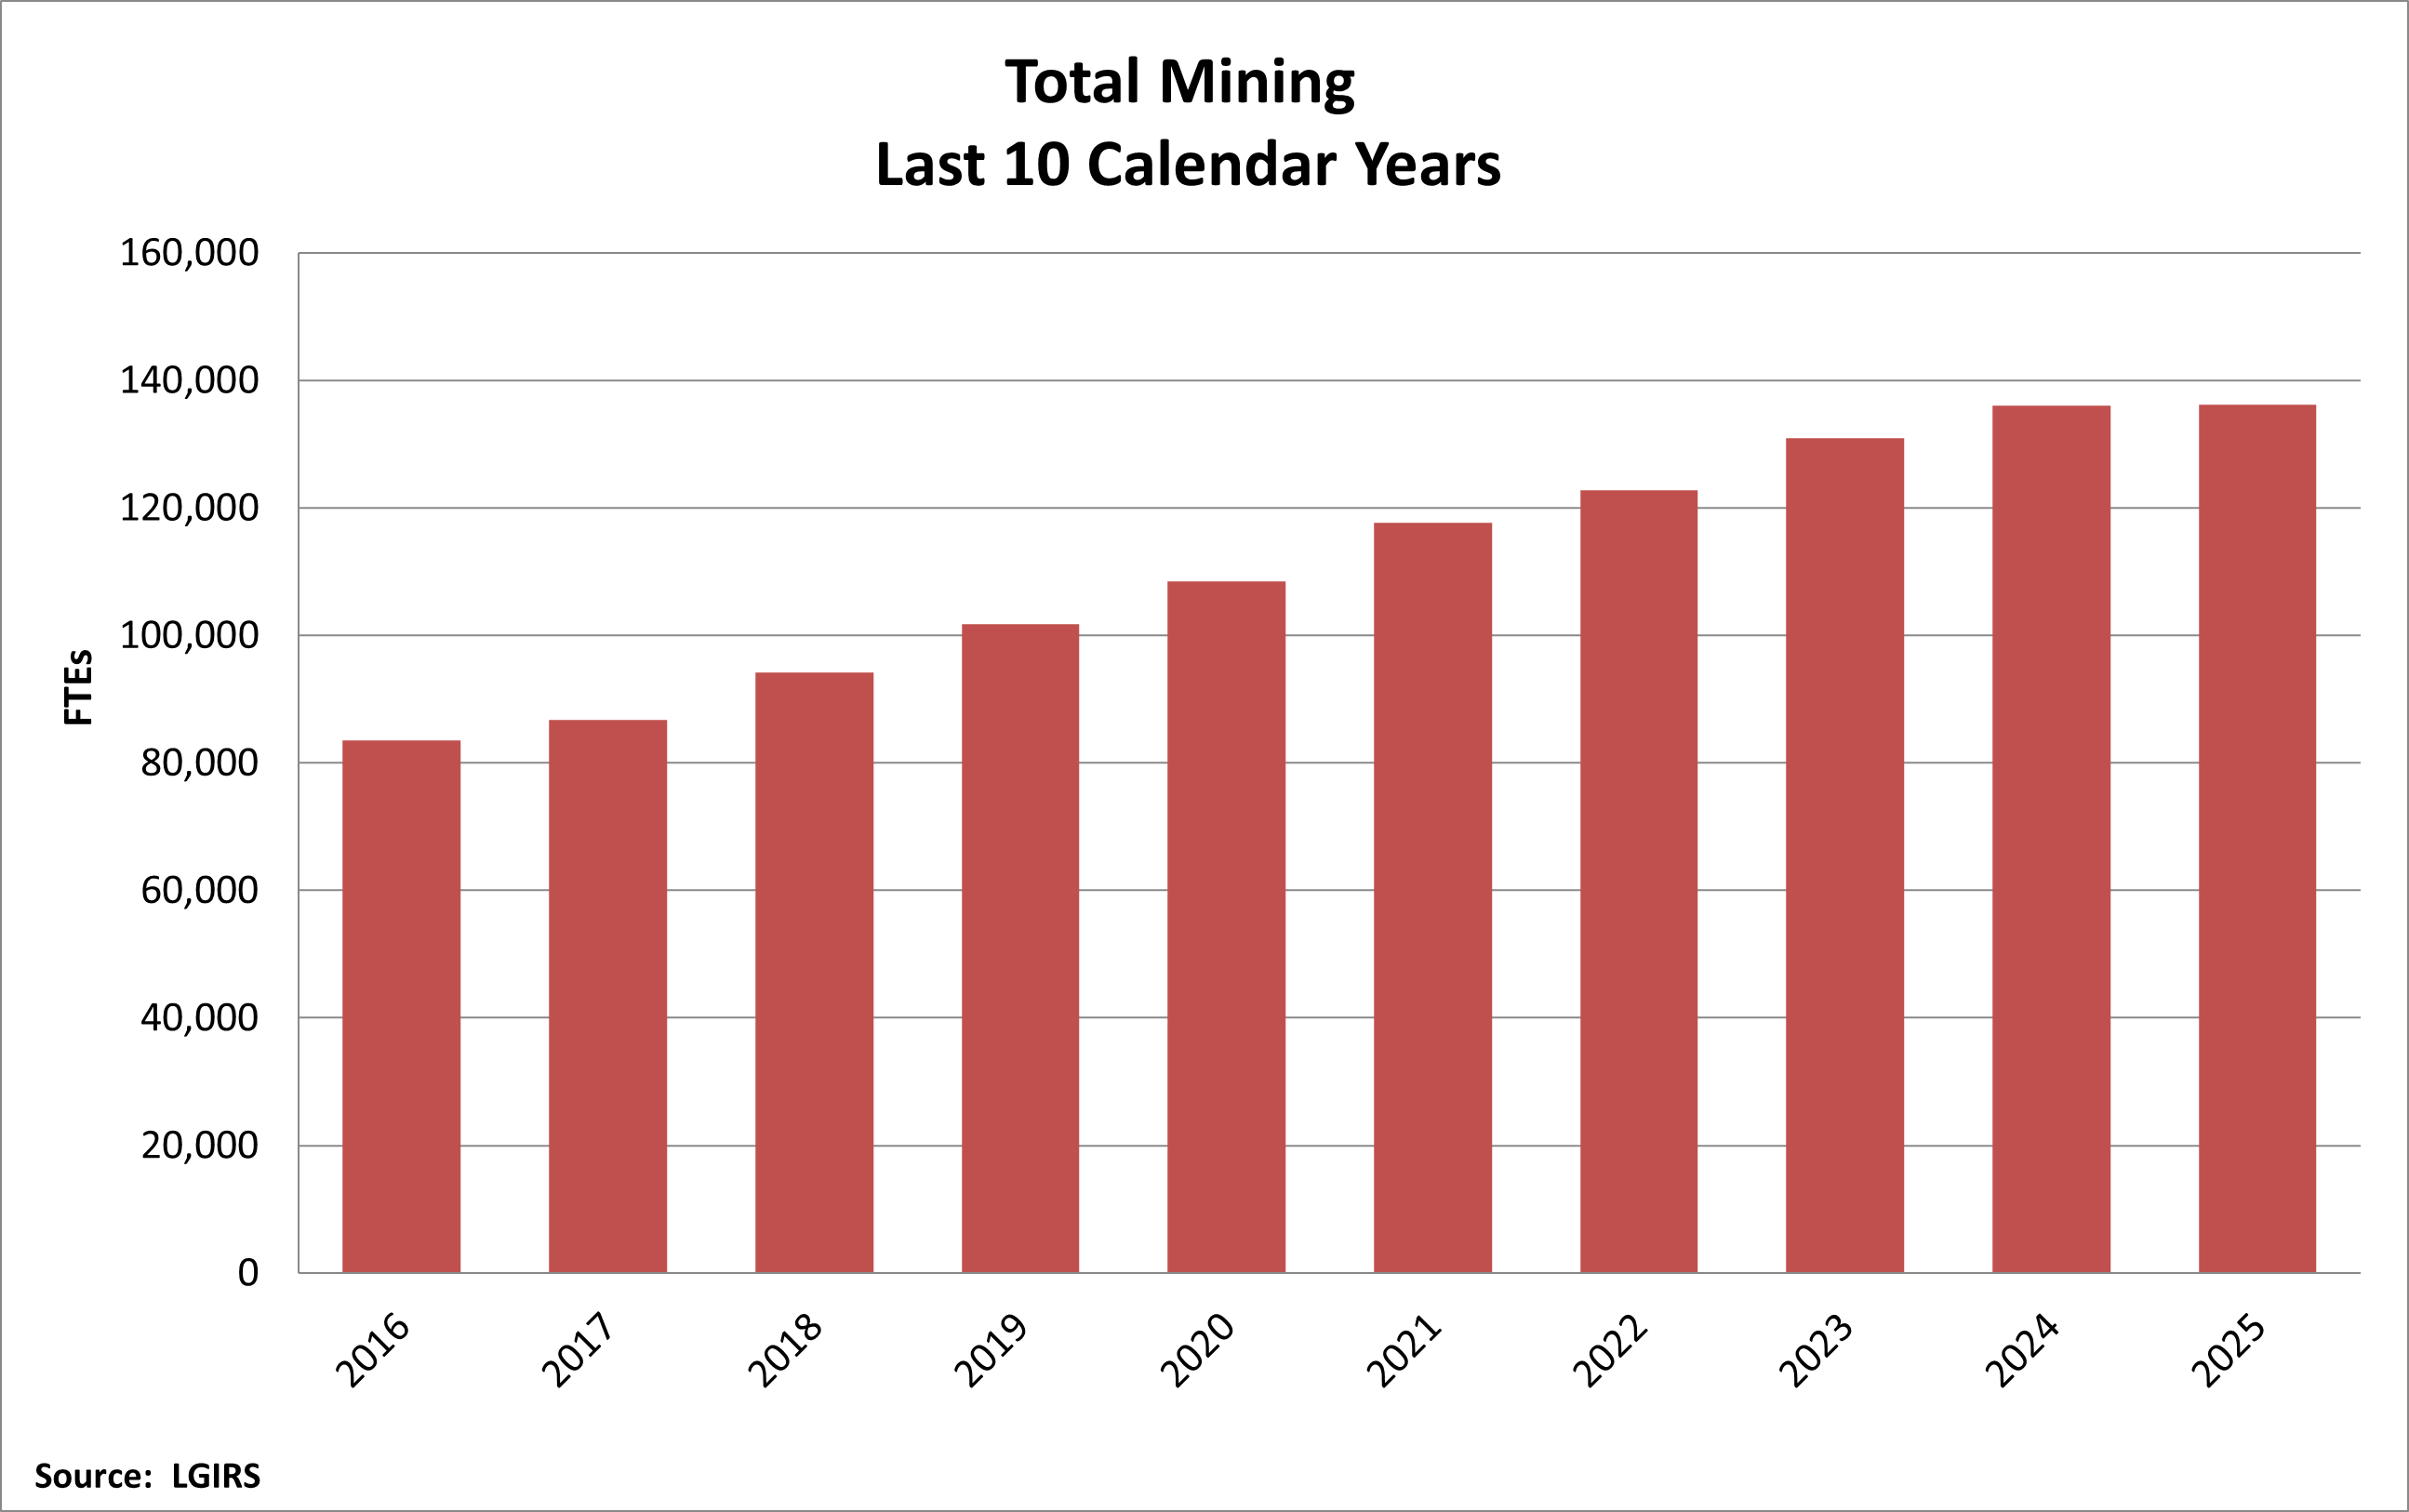
- There were more than 136,000 on-site full-time equivalents (FTE) in the mining sector. This was around the same record level as recent years, as growth in gold and iron ore employment was offset by lower nickel and lithium jobs.
- There were 11,244 people employed directly in oil and gas extraction in WA’s petroleum sector in 2025, a rebound from 2024 and largely in line with previous years.
- WA’s mineral exploration expenditure was a record $2.7 billion in 2025. It continues to reflect strong levels of exploration activity in addition to higher costs, with the same amount of spending yielding fewer metres drilled compared to a few years ago.
- Petroleum exploration expenditure in WA fell to its lowest level in almost 30 years at $365 million in 2025 with activity significantly reduced in recent years, particularly in the Carnarvon Basin.
- Investment in WA’s mining and petroleum industries increased to a decade-high of $34 billion.
- DMPE’s analysis of information on mineral, petroleum and associated infrastructure projects in the investment pipeline, shows that as of March 2026:
- there was $55 billion in projects committed and under construction, compared to $50 billion as of September 2025; and
- the estimated capital cost of medium to longer-term projects (i.e. undergoing scoping, pre-feasibility and definitive feasibility studies) was $121 billion compared to $122 billion as of September 2025.
- The mining and petroleum sector continued to provide significant benefit to the State through royalties and related revenues valued at $10.6 billion in 2025.
2025 economic indicators data file
Employment
Mining
There were more than 136,000 on-site FTEs in the mining sector in 2025. This was around the same record level as recent years, with growth having stalled.
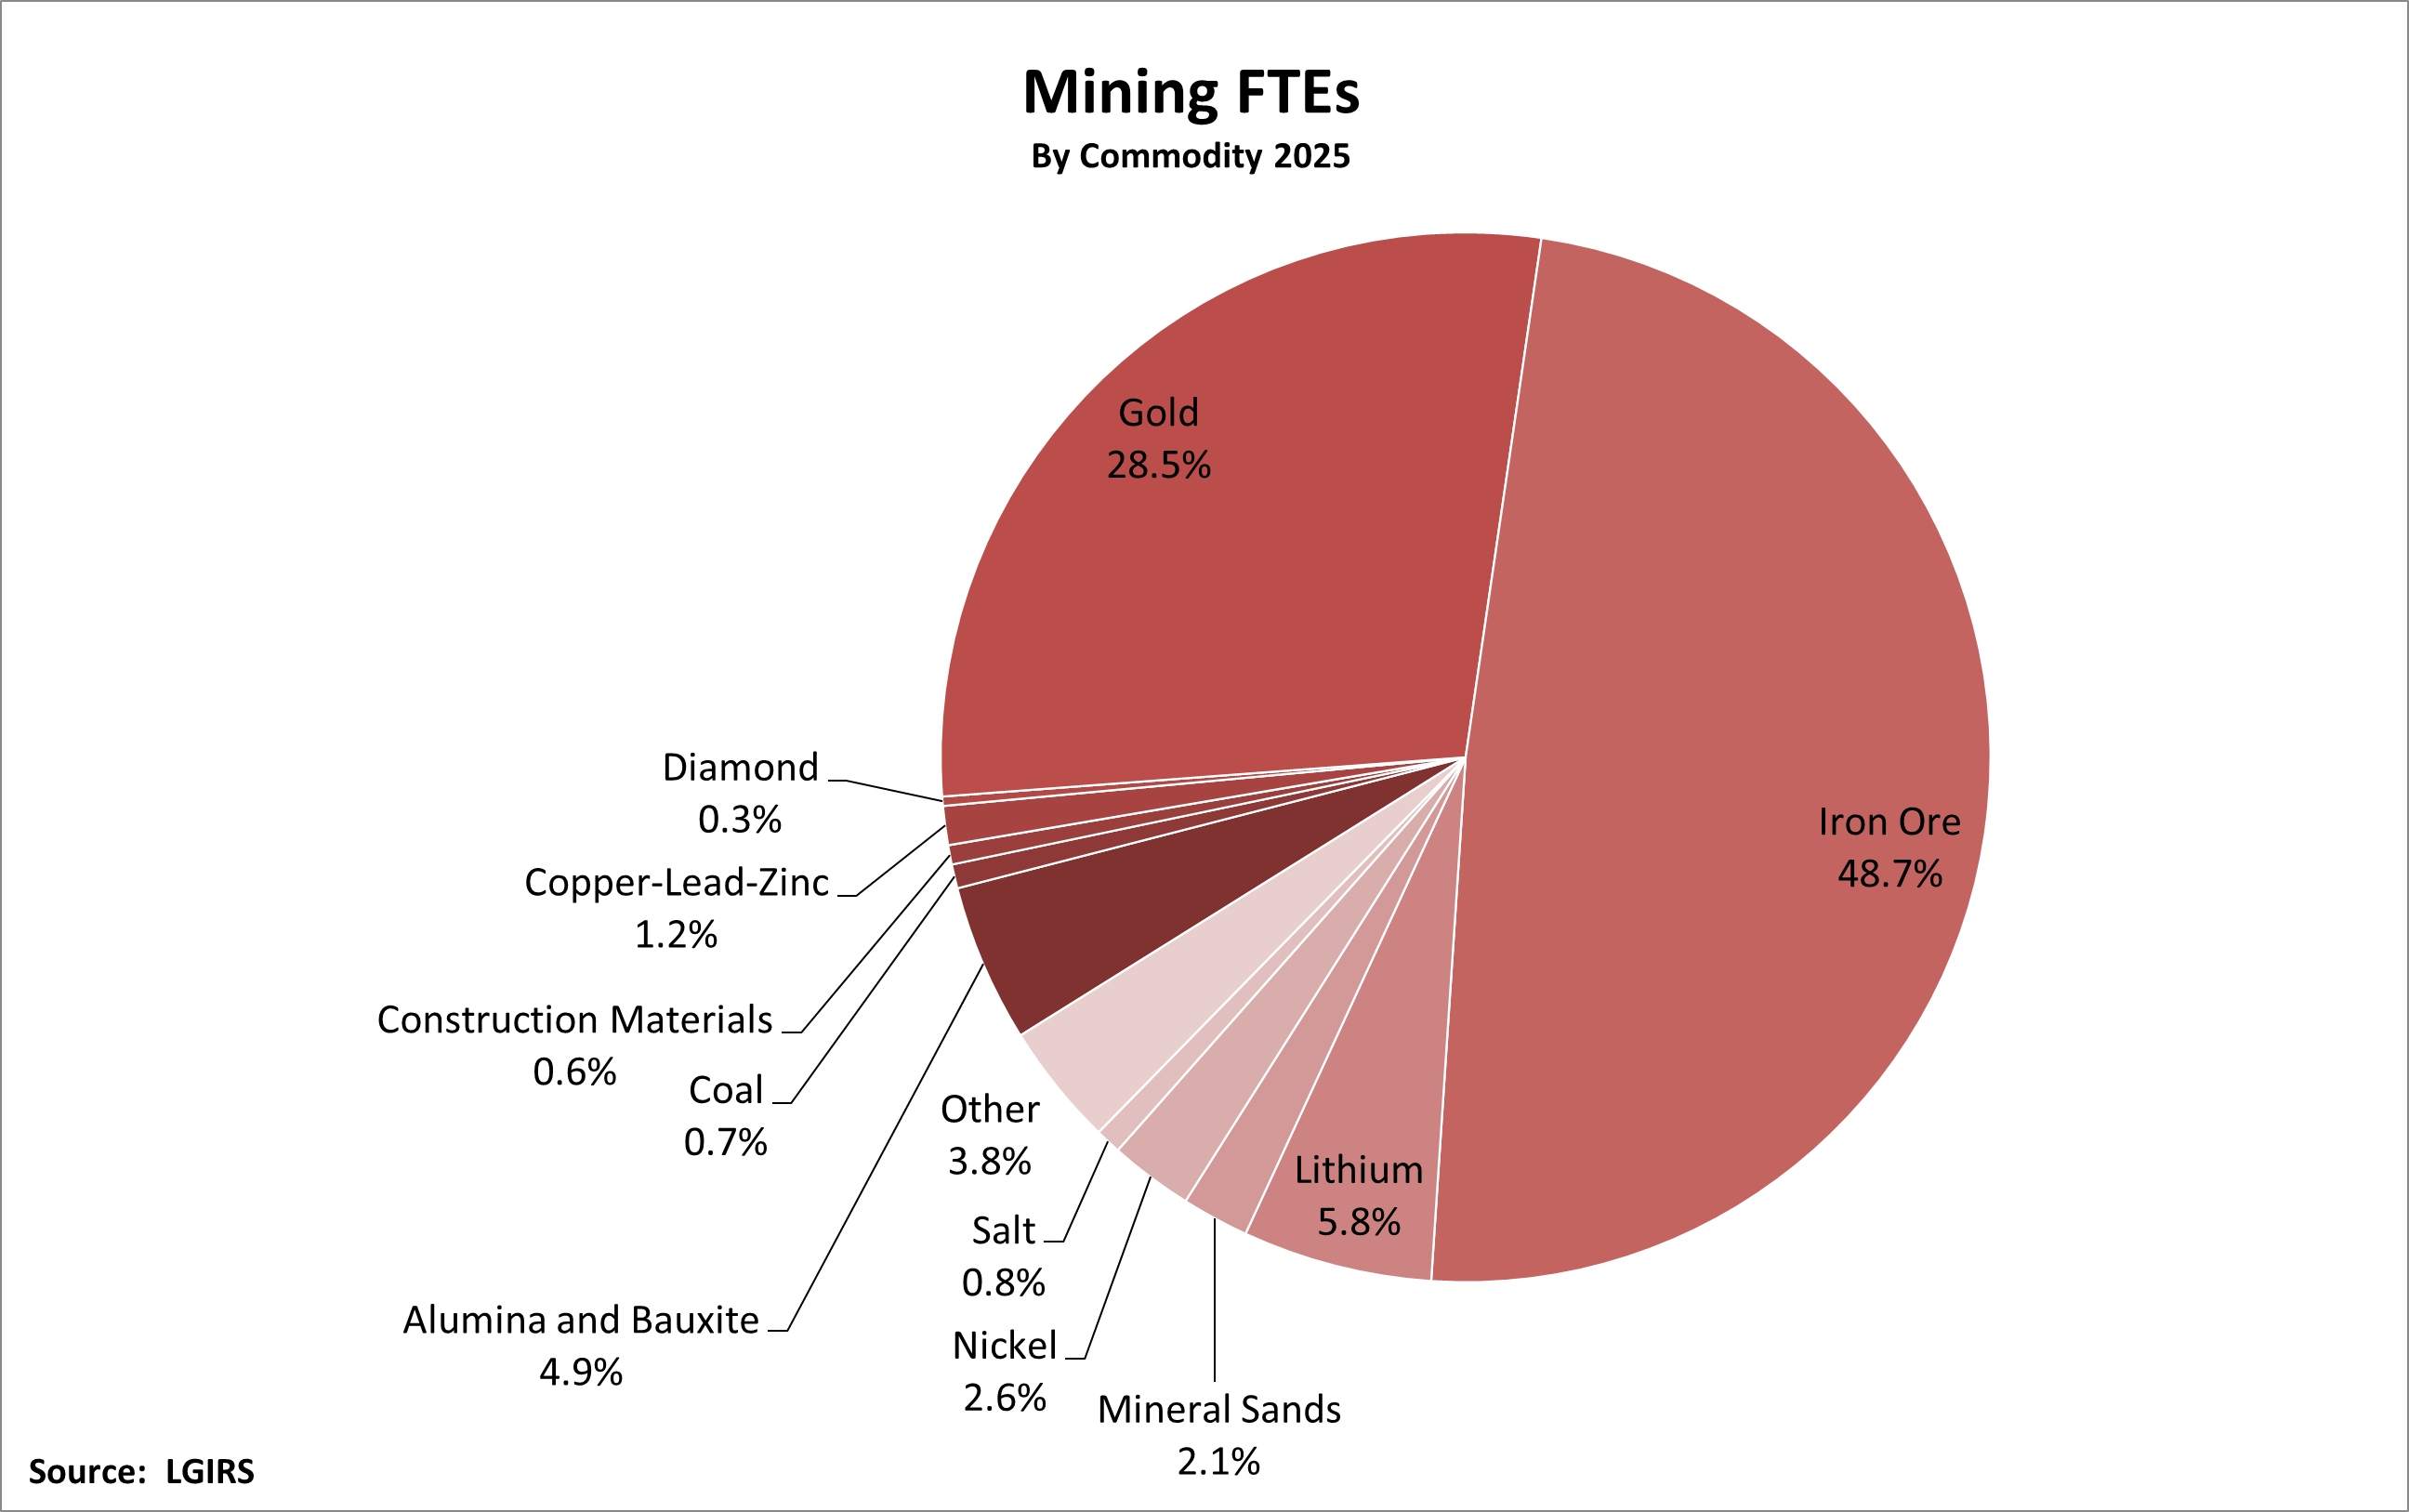
The biggest contributors to on-site mining jobs were:
- Iron ore: 66,367 FTEs;
- Gold: 38,816 FTEs;
- Lithium: 7,954 FTEs;
- Alumina and bauxite: 6,634 FTEs; and
- Mineral sands: 2,823 FTEs.
The gold and iron ore industries continued to grow due to new projects and expansions:
- Gold: grew by more than 5,000 FTEs; and
- Iron ore: grew by more than 1,000 FTEs.
However, they were offset by falls in:
- Lithium: down almost 3,500 FTEs from 11,422 FTEs in 2024 due to the completion of construction at Liontown Resources’ Kathleen Valley project and Covalent Lithium’s Mount Holland project, as well as suspensions at Rio Tinto’s Mt Cattlin, Mineral Resources’ Bald Hill and PLS’ Ngungaju plant at Pilgangoora; and
- Nickel: around 3,500 FTEs compared to 7,954 FTEs in 2024 and 10,891 FTEs in 2023, following the suspension of several projects during 2024, including, most notably, BHP’s Western Australian nickel operations, FQM’s Ravensthorpe, and IGO’s Cosmos development project.
Minerals exploration
There were 4,543 FTEs in minerals exploration, around the same level as recent years of between 4,000 and 4,500 FTEs.
Petroleum
There were 11,244 people employed directly in oil and gas extraction in WA’s petroleum sector in 2025, a rebound from 2024 and largely in line with previous years. It likely reflects the relative stability in the State’s large-scale liquefied natural gas (LNG) production over this period.
Exploration
Minerals
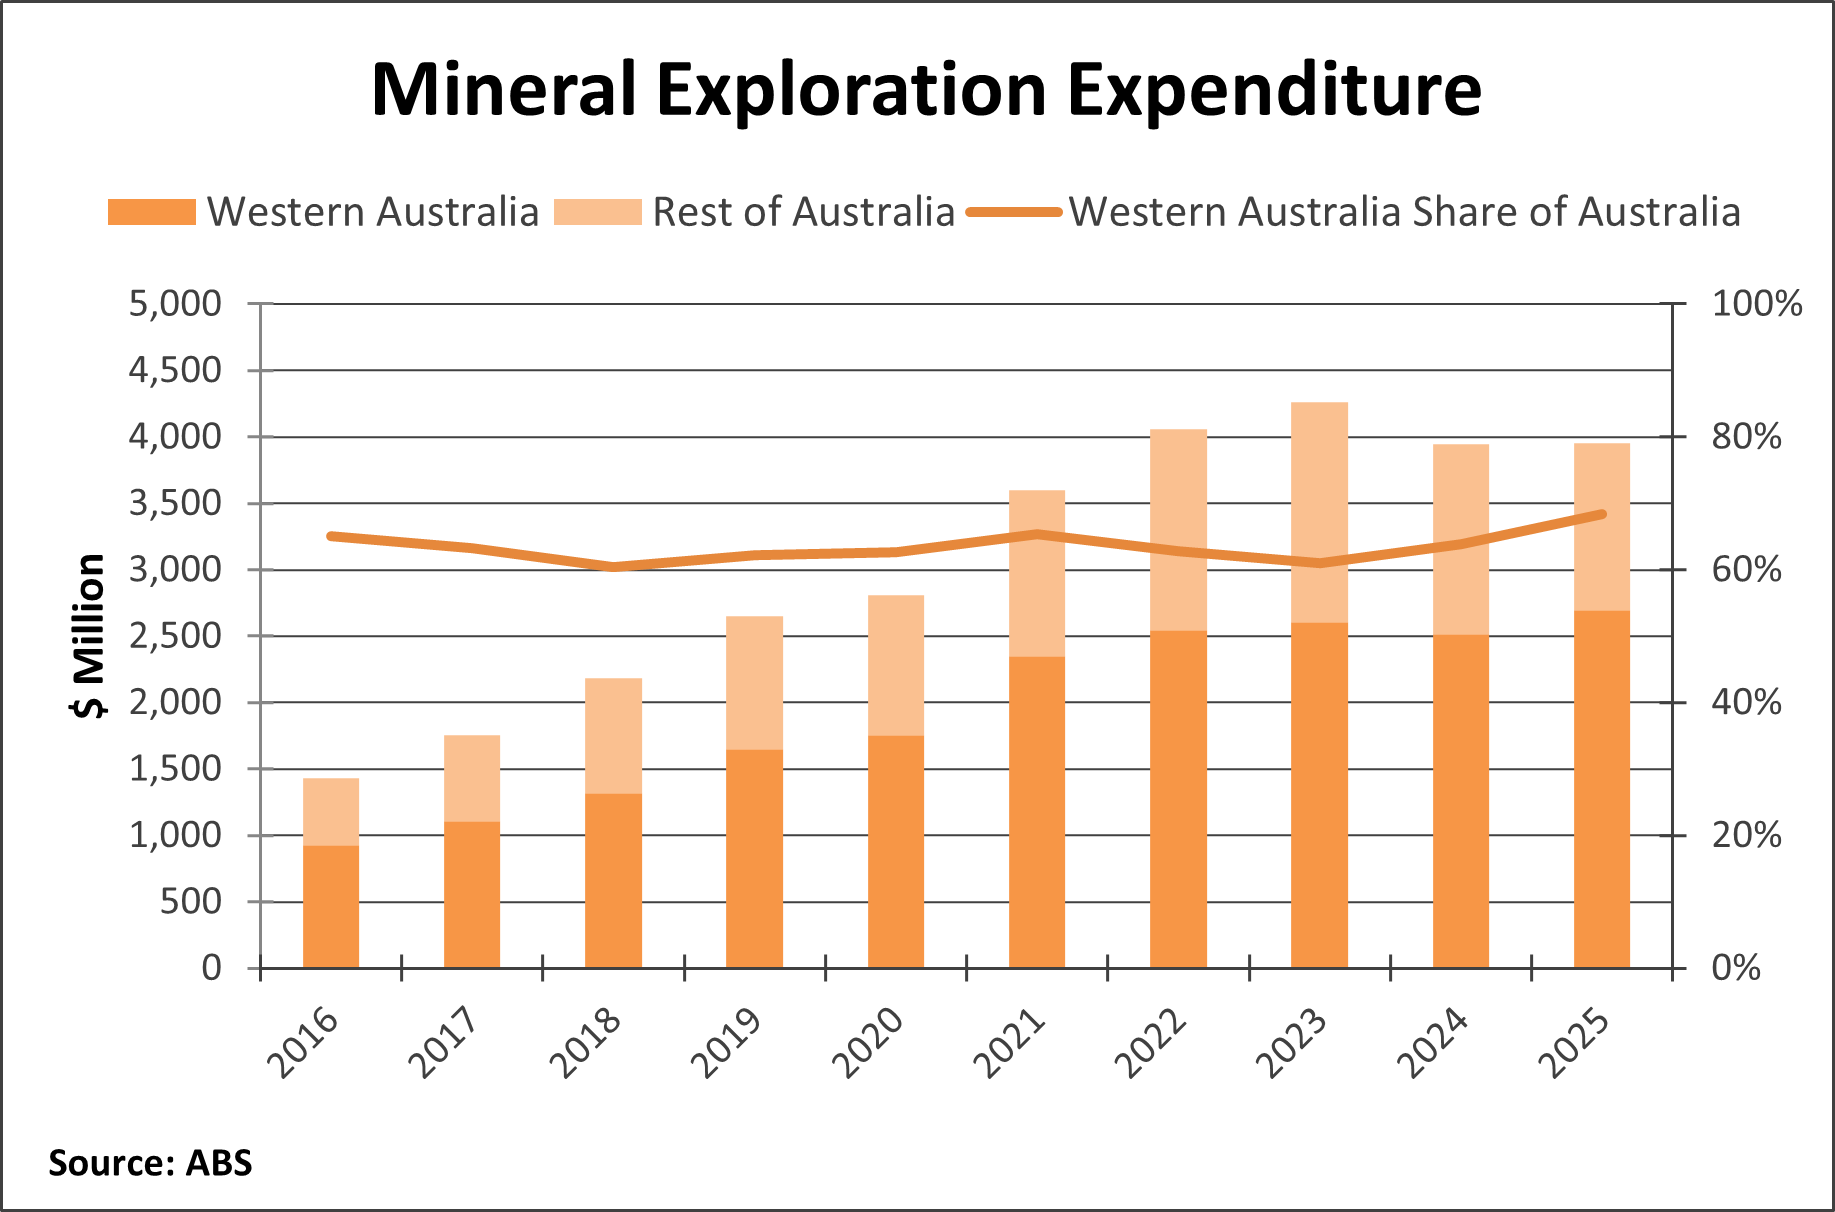
WA’s mineral exploration expenditure was a record $2.7 billion in 2025.
It continues to reflect strong levels of exploration activity in addition to higher costs with the same amount of spending yielding fewer metres drilled compared to a few years ago.
The main targets of exploration spend:
- Gold: reached new record levels of exploration spending of almost $1.3 billion backed by supportive equity markets in an extremely high price environment; and
- Iron ore: $785 million in spend, still the highest spend in more than a decade.
Spending on gold and iron ore exploration more than offset reduced spend targeting a host of other mainly critical minerals:
- Other minerals (which includes lithium and rare earths): $287 million, falling from $486 million in 2024; and
- Nickel and cobalt: a six-year low of $150 million, down from $192 million in 2024, amid market challenges.
A total of $147 million was also spent on copper exploration, stable year-on-year but lower than its peak of greater than $250 million in 2021.
More spending was focused on brownfields areas, which reached a record $2.1 billion in 2025, while greenfields spending dropped to $589 million. Brownfields exploration is often cheaper and less risky, making it more appealing in a higher-cost environment.
WA remains Australia’s top destination for exploration, accounting for 68 per cent of the national spend, above its longer-term average of 63 per cent.
Petroleum
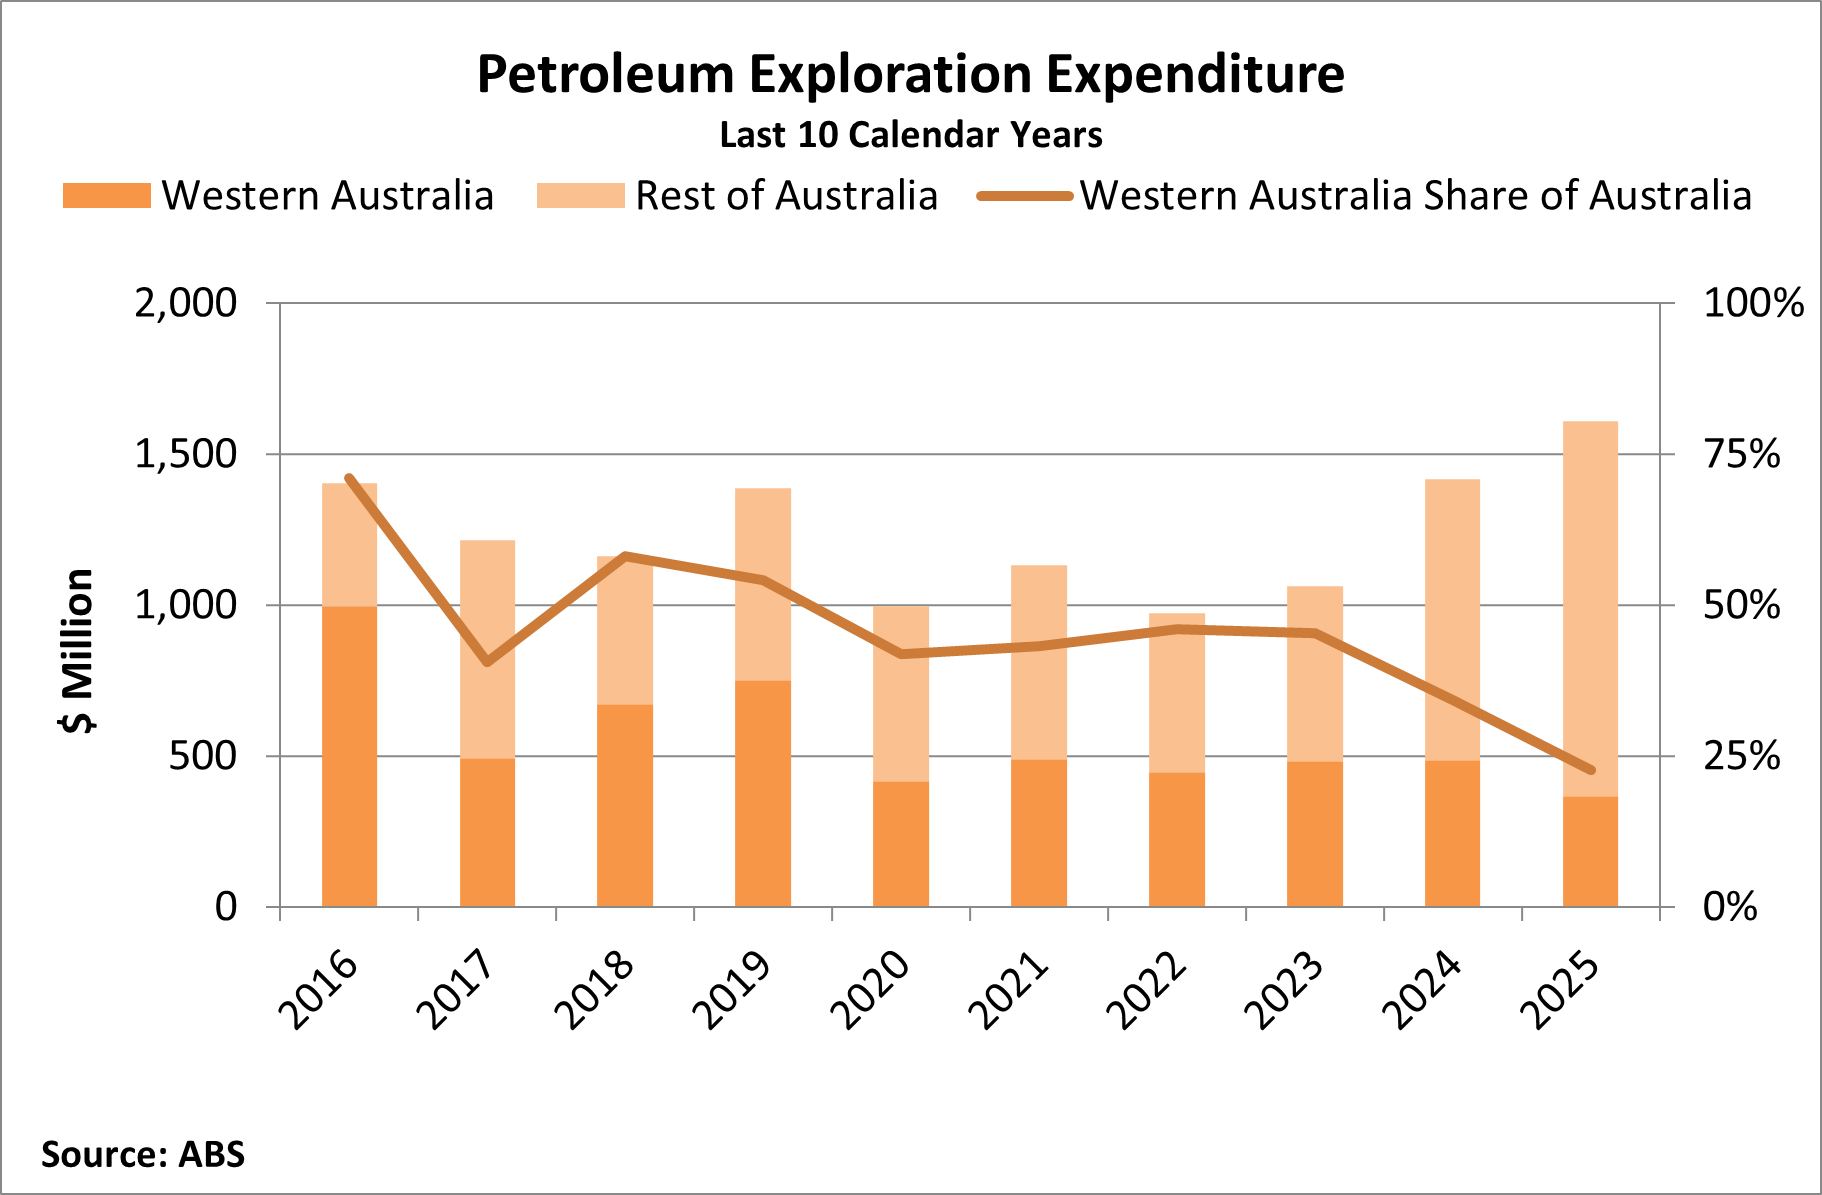
Petroleum exploration expenditure in WA fell to its lowest level in almost 30 years at $365 million in 2025, with activity significantly reduced in recent years, particularly in the Carnarvon Basin.
WA’s share of national petroleum exploration spending declined to a new low of 23 per cent as expenditure in the rest of Australia increased to a decade high in part due to increased activity in Queensland’s Taroom Trough and the Northern Territory’s Beetaloo Sub-basin.
Investment
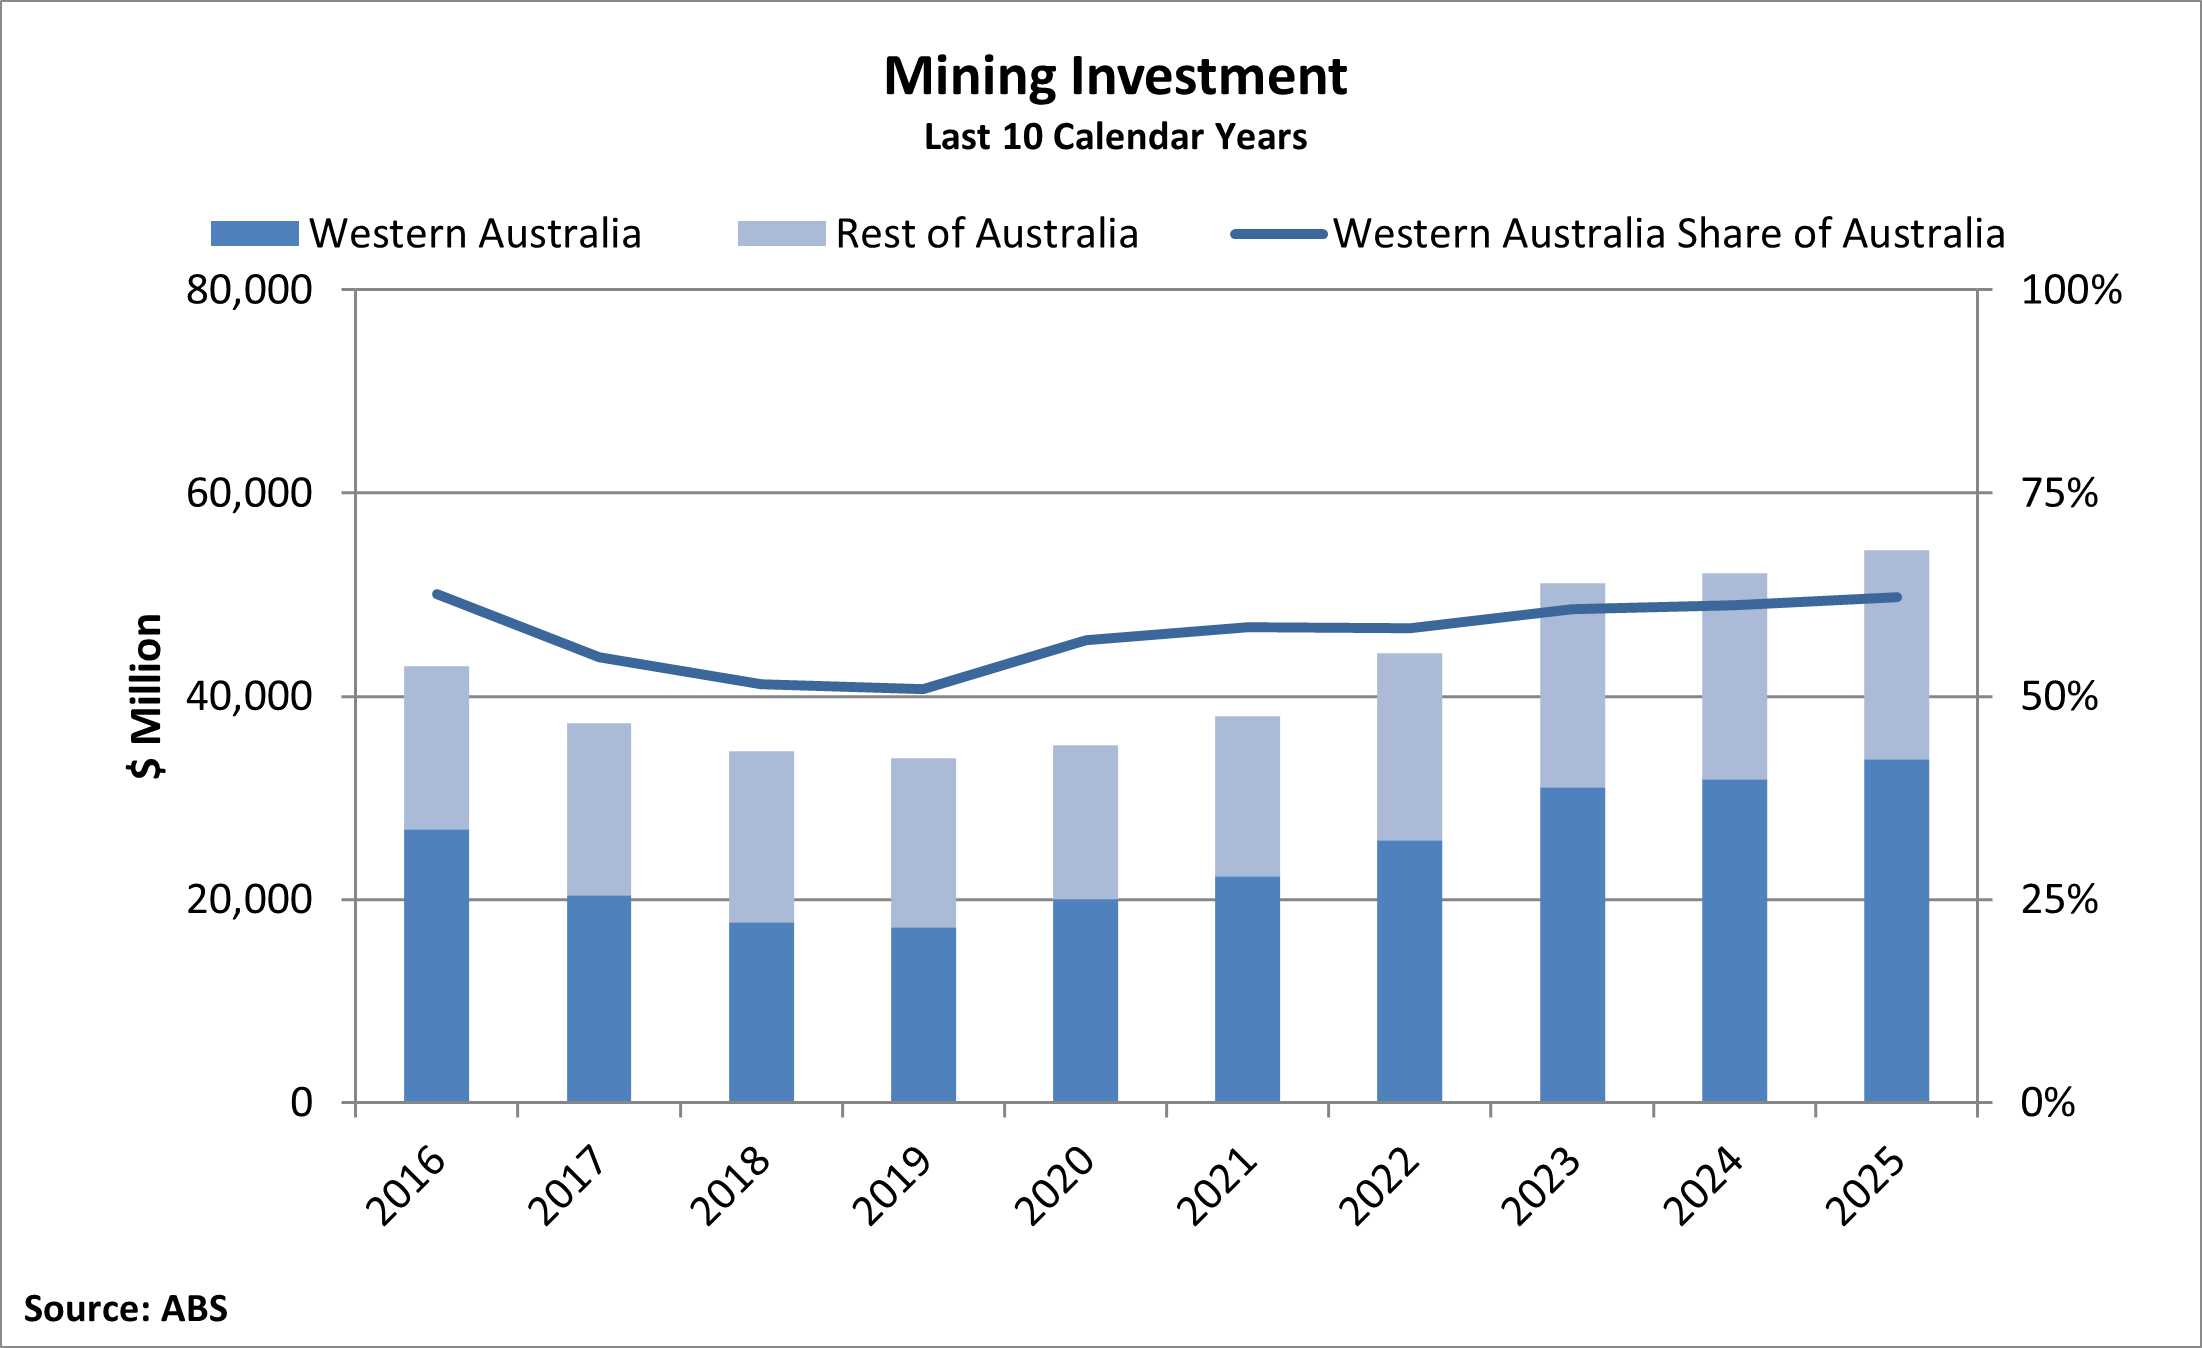
Investment in WA’s mining and petroleum industries increased to a decade-high of $34 billion in 2025.
The current key mining and petroleum investment drivers are:
- LNG: Woodside Energy’s Scarborough project, Shell’s Crux project and Chevron’s Jansz-Io Compression project.
- Iron Ore: Rio Tinto’s Brockman Syncline 1 and BHP’s Western Ridge Crusher project.
- Gold: Kalgoorlie Consolidated Gold Mines’ Mill Expansion.
- Infrastructure: BHP’s WA Iron Ore Debottlenecking Project 2.
- Other minerals: BCI Minerals’ Mardie salt project and Iluka Resources’ Eneabba Rare Earths Refinery.
While investment has grown steadily to this level since the bottom of the investment cycle in early 2019, it was still only around two-thirds of the peak levels during the mining investment boom of a decade ago.
WA accounted for 62 per cent of national mining and petroleum investment, among its highest levels in the last three decades.
The resources sector remained the dominant driver of capital expenditure in WA contributing 69 per cent of total new capital expenditure in the State, slightly lower than recent years and well below the peak contribution of more than 80 per cent during the mining construction boom years.
The Department of Mines, Petroleum and Exploration also monitors and collects information on mineral, petroleum, and associated infrastructure projects in the investment pipeline and estimates the capital costs of these projects.
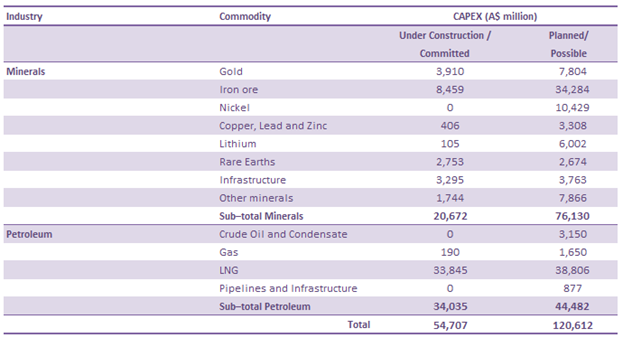
Analysis of this information shows that, as of March 2026, there were projects:
- Under construction and committed: valued at $55 billion, compared to $50 billion as of September 2025; and
- Medium-to-longer-term planned and possible projects: valued at an estimated $121 billion compared to $122 billion as of September 2025.
The key projects supporting ongoing under construction and committed mining and petroleum investment largely remained unchanged (as listed above).
However, the pipeline of projects under development has grown, mainly through Final Investment Decisions on:
- LNG: Chevron’s Gorgon Stage 3 (Geryon and Eurytion) and Woodside Energy’s Greater Western Flank-4.
- Iron ore: Rio Tinto’s West Angelas sustaining project.
- Gold: Rox Resources’ Youanmi project, Ramelius Resources’ Mount Magnet Mill upgrade and Rebecca-Roe project, and Medallion Metals’ Ravensthorpe project.
- Copper-Lead-Zinc: Boab Metals’ Sorby Hills project and Cyprium Metals’ Nifty cathode project.
At the same time, construction on Talison Lithium’s Greenbushes lithium Chemical Grade Processing Plant 3 expansion and Mitsui & Co and Beach Energy’s Waitsia gas Stage 2 expansion were completed.
The fall in the estimated value of medium to long-term projects largely reflected the transition of projects listed above from the feasibility stage into development and construction.
However, some longer-term projects also stalled including Lake Mackay potash (owner Agrimin has fully or partially surrendered project tenements), Barrambie titanium (owner Neometals is intending to divest the project), and Munglinup graphite (owner Mineral Commodities entered administration in early 2026).
There were also a host of significant new projects and updated development studies contributing to the medium-to-long term pipeline of projects including:
- Greatland Gold’s Havieron underground gold;
- Fenix Resources Weld Range iron ore expansion;
- Cyprium Metals’ Nifty (concentrate) copper;
- Tronox’s rare earths Cracking and Leaching Plant; and
- Pilot Energy’s Cliff Head Carbon Capture and Storage.
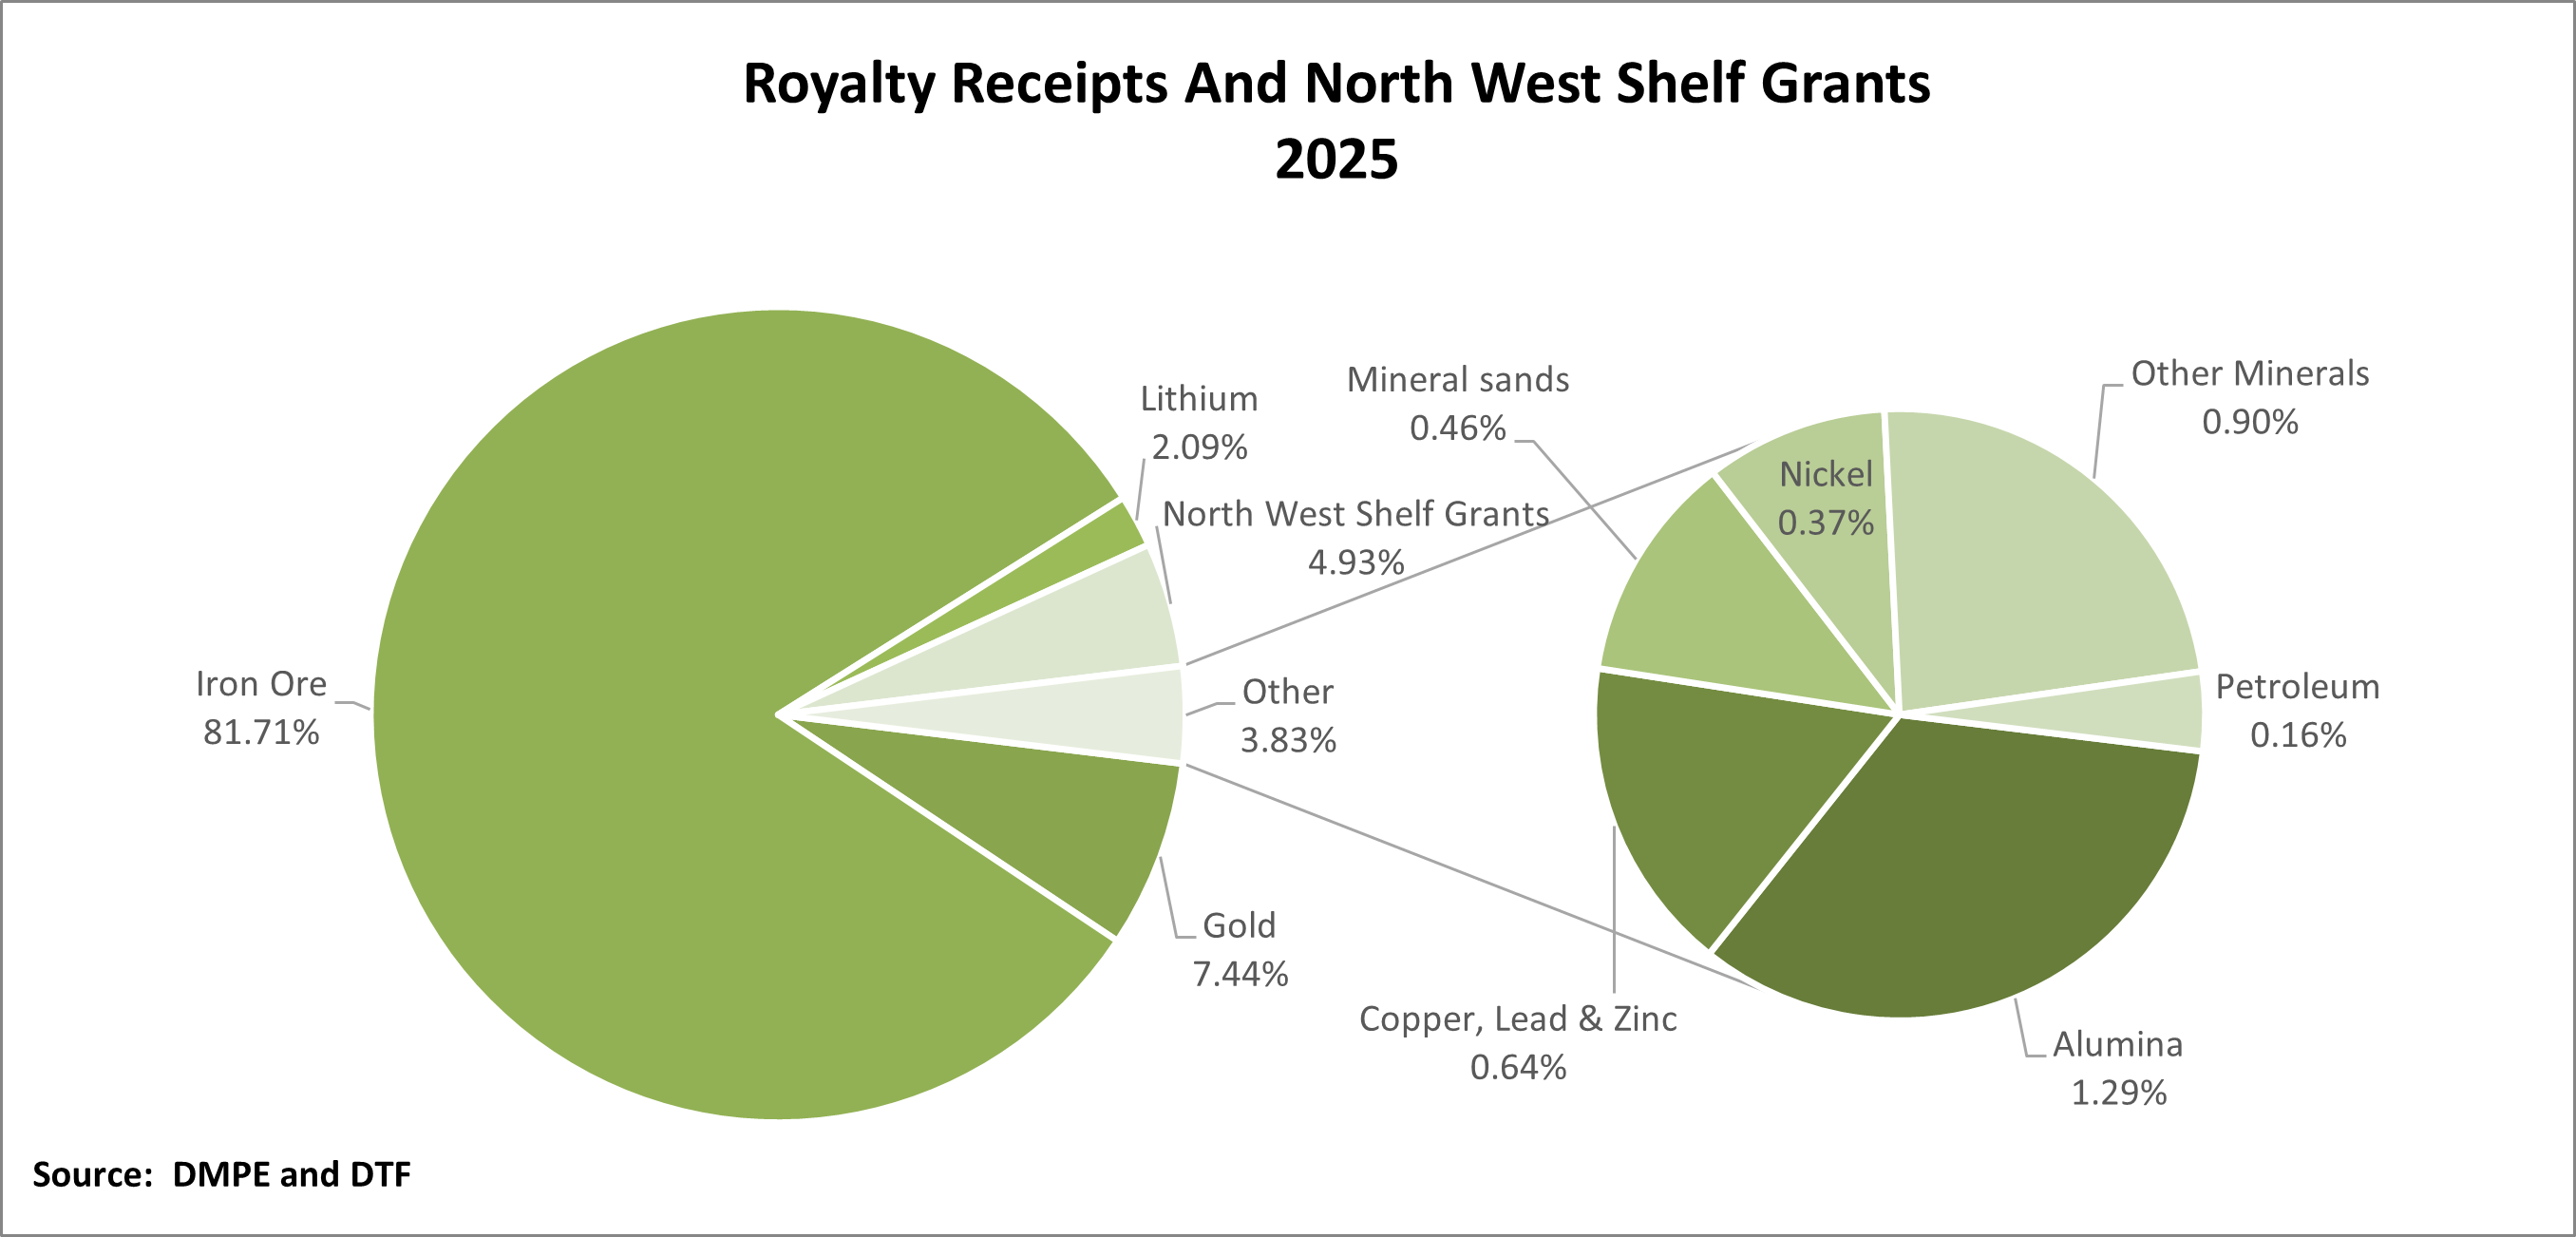
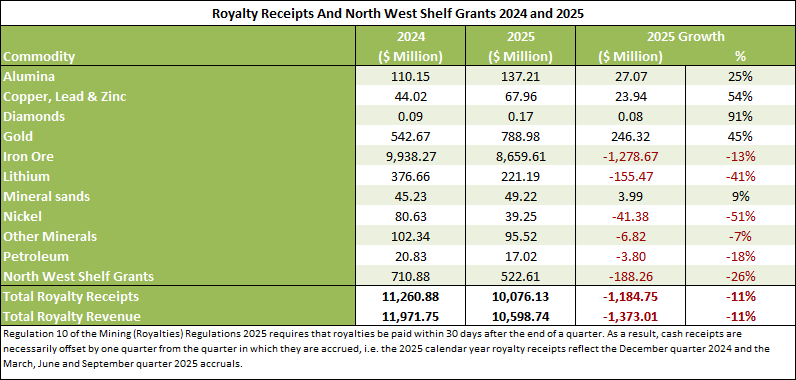
The mining and petroleum sector continued to provide significant benefit to the State through royalties and related revenues valued at $10.6 billion in 2025.
While WA produces a larger number of minerals, iron ore production has been and remains, by far, the dominant source of royalty income.
It provided $8.7 billion in royalties in 2025, or more than 80 per cent of total royalty and related revenues including additional lease rental amounts applied to iron ore obtained from a mining lease 15 years from the date iron ore was first obtained from the mining lease.
The iron ore industry also pays the largest share of gross revenue from sales at 7.5 or 5 per cent, reflecting limited value-add in the industry outside of beneficiated hematite ores and magnetite concentrate production.
Royalties from the gold industry were a record $789 million (up by almost half) and its share of total royalties and related revenues grew to 7 per cent in an environment of extraordinarily high prices.
Gold royalties are typically levied at 2.5 per cent owing to the local upgrading of gold ores to doré and pure bullion. However, as gold projects receive an exemption on royalties for their first 2,500 ounces of production, the overall royalty return to Government from gross revenue on gold is marginally less than 2.5 per cent.
Oil and gas provided the third largest amount of royalties to the State at $540 million. They were principally through WA’s share of the Commonwealth Government’s royalties (around two-thirds) from the North West Shelf (NWS) project (paid as a grant from the Federal Government to WA) valued at $523 million. Additional royalties of $17 million flowed to WA from operations in State onshore and coastal areas, including 25 per cent of the Barrow Island Resource Rent Royalty with the Commonwealth receiving the other 75 per cent.
Importantly, except for the NWS project, WA does not receive royalties from oil and gas production that originates from fields located within the Federal Government’s offshore areas, including other large-scale LNG projects. This reflects the Federal Government’s responsibility for its administration and regulation.
On account of the split administrative responsibilities for petroleum, and a relatively small petroleum industry in onshore and coastal areas of WA, the State Government’s royalties represent a relatively small percentage of gross revenues from all oil and gas production in WA.
The lithium industry paid $221 million or around five per cent of gross revenues less allowable deductions, such as shipping and packaging costs. This is lower than iron ore but higher than gold as the industry produces and pays royalty on spodumene concentrate, an intermediate product, including when used as feedstock in lithium hydroxide production.
Royalties of $137 million were also paid on alumina sales. However, it provided the lowest royalty return relative to the value of production of all the high-value minerals produced in WA in accordance with the royalty rate of 1.65 per cent under Alumina Refinery State Agreements.