This page presents a snapshot of the public sector workforce based on the most recent data available. More detailed workforce information (including information on other government entities) is available in the State of the Western Australian Government Sector Workforce.
Please see About our workforce data for additional contextual information.
Disclaimer
The Western Australian Government is committed to quality service to its customers and makes every attempt to ensure accuracy, currency and reliability of the information contained on the Public Sector Commission’s website or in its publications. However, changes in circumstances over time may impact on the veracity of this information.
Overview
Show more| Headcount | 148,408 | |
|---|---|---|
| Full-time equivalent (FTE) | 117,773 | |
| General government expenses (September quarter) | $3,319M | |
| Senior Executive Service (SES) | 413 | |
| Women in SES | 175 | |
| Aboriginal and Torres Strait Islander | 2.7% | |
| People with disability | 1.5% | |
| Culturally and linguistically diverse | 14.2% | |
| Youth (aged 24 and under) | 3.9% | |
| Mature (aged 45 and over) | 52.6% | |
| Median age | 46 | |
Top 3 occupation groups (FTE)
| Teachers | 19.3% |
|---|---|
| Clerical workers | 16.5% |
| Nurses and midwives | 10.9% |
Sector profile
Show moreEmployment trends
In September 2020 the WA public sector employed 148,408 people, equating to 117,773 full-time equivalent (FTE) employees.
In headcount terms, this reflected a quarterly increase of 1,846 (+1.3%) since June 2020, and an annual increase of 4,633 (3.2%) since September 2019. In FTE terms, this reflects a quarterly increase of 895 (+1.2 per cent) since June 2020 and an annual increase of 4,406 (+3.9 per cent) since September 2019.
WA Health continues to drive growth in staffing levels, accounting for over 60% of the 1,846 increase in headcount this quarter. Between June and September 2020, WA Health headcount increased by 1,138 (+2.3%) while FTE increased by 653 (+1.7%). These increases reflect WA Health maintaining preparedness to respond to COVID-19, through both COVID-19 specific positions and coverage of positions where staff have been reallocated to COVID-19 response.
The Department of Education also contributed to the increase, with headcount up by 468 (+0.8%) and FTE up by 39 (+0.1%) between June and September 2020:
- Growth was due largely to ongoing growth in student numbers, resulting in an additional headcount of 452 teachers and 393 education assistants. Most of these staff were casual and worked less than one FTE, resulting in a smaller increase in FTE than headcount.
- Increases in teaching staff were offset by a decrease of 348 fixed term cleaners (headcount) in the Department of Education, occurring approximately six months from the end of March 2020 when staff were engaged to respond to emerging COVID-19 related health and safety requirements.
TAFE colleges also increased, up 205 headcount (211 FTE) since June 2020, in line with the resumption of semester.
In response to the COVID-19 pandemic, VenuesWest reduced its workforce from 518 employees (262 FTE) in September 2019 to 233 employees (107 FTE) in September 2020. VenuesWest reported that casual employees have started to be re-engaged as normal business at VenuesWest venues resumes.
Salaries expenditure
Salaries represent the single largest component of general government expenses (42% for the September 2020 quarter).
General government salaries totalled $3,319 million in the first three months of 2020–21 (an increase of 5.7% compared to the same period in the prior year), with a decade average of 4.5% per annum.
Figure 1. Salaries growth for the September quarter since 2010–11 (general government)
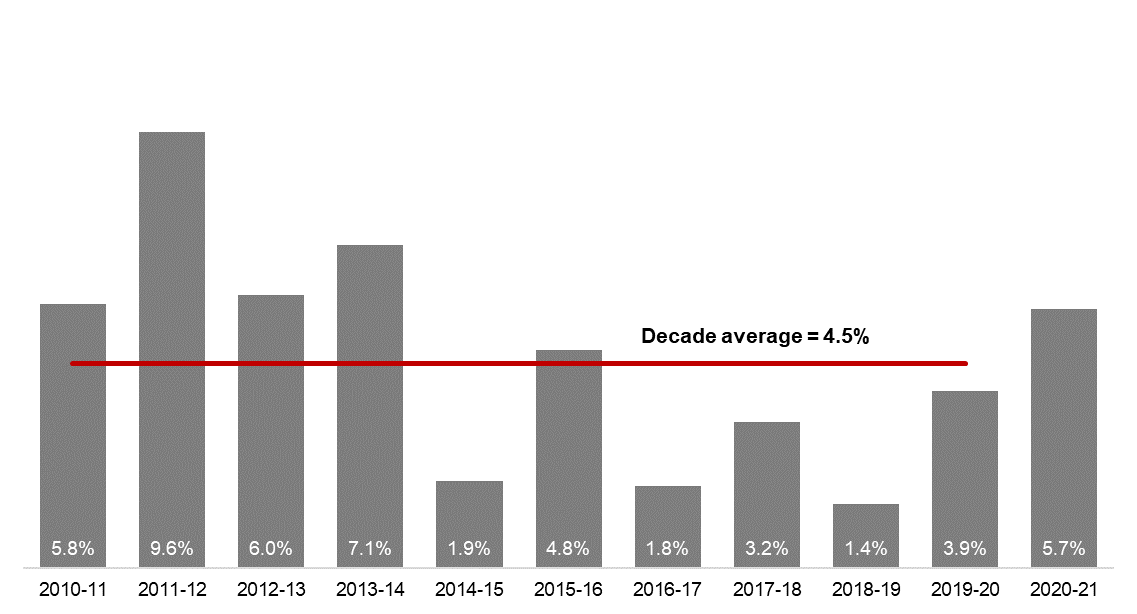
Source: Department of Treasury
Historical headcount, FTE and salaries expenditure
Show more| Quarter | Headcount | FTE | Salaries expenditure ($M) |
|---|---|---|---|
| September 2015 | 139,277 | 109,919 | 2,837 |
| December 2015 | 137,520 | 108,325 | 2,888 |
| March 2016 | 137,371 | 108,722 | 2,801 |
| June 2016 | 135,770 | 107,809 | 2,857 |
| September 2016 | 137,746 | 109,295 | 2,887 |
| December 2016 | 135,936 | 106,830 | 2,931 |
| March 2017 | 139,144 | 109,895 | 2,880 |
| June 2017 | 140,403 | 110,662 | 2,912 |
| September 2017 | 141,609 | 111,472 | 2,980 |
| December 2017 | 137,878 | 108,371 | 3,029 |
| March 2018 | 140,799 | 110,404 | 3,049 |
| June 2018 | 139,812 | 110,373 | 3,135 |
| September 2018 | 141,744 | 111,255 | 3,023 |
| December 2018 | 138,678 | 108,601 | 3,091 |
| March 2019 | 142,278 | 112,099 | 2,982 |
| June 2019 | 142,735 | 111,932 | 3,172 |
| September 2019 | 143,775 | 113,367 | 3,140 |
| December 2019 | 143,586 | 113,143 | 3,212 |
| March 2020 | 146,343 | 115,548 | 3,147 |
| June 2020 | 146,562 | 116,878 | 3,366 |
| September 2020 | 148,408 | 117,773 | 3,319 |
WA public sector entities staffing levels
Show more| Agency | Sep-20 Headcount | Sep-20 FTE | FTE change from Jun-20 | FTE change from Sep-19 |
|---|---|---|---|---|
| Western Australian Public Sector | 148,408 | 117,773 | 895 | 4,406 |
| Department of Education | 55,530 | 41,748 | 39 | 1,200 |
| WA Health | 49,973 | 38,085 | 653 | 1,857 |
| North Metropolitan Health Service | 11,541 | 8,739 | 163 | -76 |
| WA Country Health Service | 10,378 | 7,882 | 223 | 317 |
| South Metropolitan Health Service | 9,335 | 7,070 | 114 | 297 |
| East Metropolitan Health Service | 8,231 | 6,455 | 56 | 274 |
| Child and Adolescent Health Service | 5,064 | 3,658 | 31 | 576 |
| Health Support Services | 2,176 | 1,589 | 27 | 197 |
| PathWest | 2,149 | 1,743 | 5 | 115 |
| Department of Health | 1,099 | 948 | 34 | 156 |
| Department of Justice | 7,328 | 6,833 | 68 | 597 |
| Department of Communities (i) | 6,111 | 5,357 | -140 | -39 |
| Western Australia Police (ii) | 2,930 | 2,175 | 12 | 62 |
| Department of Biodiversity, Conservation and Attractions (iii) | 2,213 | 1,852 | 16 | 56 |
| Public Transport Authority | 2,188 | 2,104 | 30 | 165 |
| Department of Primary Industries and Regional Development (iv) | 1,789 | 1,611 | 27 | 66 |
| Department of Fire and Emergency Services | 1,775 | 1,662 | 18 | 41 |
| Department of Mines, Industry Regulation and Safety (v) | 1,742 | 1,625 | 26 | 182 |
| Department of Transport | 1,536 | 1,415 | 28 | 85 |
| North Metropolitan TAFE | 1,448 | 1,182 | 57 | -41 |
| South Metropolitan TAFE | 1,407 | 1,195 | 60 | 19 |
| Main Roads Western Australia | 1,167 | 1,123 | 24 | 95 |
| Department of Local Government, Sport and Cultural Industries | 1,156 | 936 | 36 | 55 |
| Department of Finance | 1,013 | 947 | 20 | 41 |
| Department of Water and Environmental Regulation | 969 | 868 | 0 | 23 |
| Department of Planning, Lands and Heritage | 864 | 780 | -2 | 12 |
| Department of the Premier and Cabinet | 624 | 547 | -6 | 33 |
| South Regional TAFE | 591 | 428 | 51 | 18 |
| Landgate | 503 | 463 | -11 | -12 |
| Department of Training and Workforce Development | 473 | 419 | -1 | 8 |
| Central Regional TAFE | 427 | 354 | 33 | -2 |
| Insurance Commission of Western Australia | 418 | 379 | -5 | 13 |
| Mental Health Commission | 358 | 289 | 4 | 11 |
| Legal Aid Commission of Western Australia | 355 | 309 | 1 | 4 |
| Department of Jobs, Tourism, Science and Innovation | 322 | 292 | 8 | 21 |
| North Regional TAFE | 311 | 280 | 10 | -14 |
| Office of the Director of Public Prosecutions | 296 | 268 | -2 | 14 |
| Department of Treasury | 279 | 257 | 1 | -27 |
| Lotterywest | 258 | 246 | -11 | 2 |
| VenuesWest | 233 | 107 | -89 | -155 |
| Forest Products Commission | 181 | 170 | -22 | 2 |
| Office of the Auditor General | 171 | 159 | 6 | 2 |
| Metropolitan Cemeteries Board | 170 | 152 | -3 | 5 |
| Public Sector Commission | 149 | 117 | -4 | 15 |
| ChemCentre | 145 | 136 | -1 | 2 |
| WorkCover Western Australia | 135 | 126 | 2 | 0 |
| Corruption and Crime Commission | 133 | 126 | 1 | 6 |
| Ombudsman Western Australia | 76 | 65 | 1 | 1 |
| Economic Regulation Authority | 70 | 64 | -1 | 5 |
| Small Business Development Corporation | 61 | 55 | -2 | 2 |
| Animal Resources Centre | 60 | 56 | -6 | -5 |
| GESB | 58 | 52 | 1 | 4 |
| Metropolitan Redevelopment Authority (vi) | 53 | 49 | -34 | -52 |
| Western Australian Electoral Commission | 48 | 44 | 3 | 4 |
| Legal Practice Board | 47 | 44 | -1 | 2 |
| National Trust of Australia (W.A.) | 39 | 29 | -1 | 2 |
| Department of the Registrar, Western Australian Industrial Relations Commission | 38 | 35 | 2 | 4 |
| Western Australian Meat Industry Authority | 28 | 17 | -1 | -2 |
| Construction Training Fund | 24 | 21 | -1 | 2 |
| Health and Disability Services Complaints Office | 22 | 19 | -2 | 3 |
| Equal Opportunity Commission | 21 | 20 | 0 | 0 |
| Commissioner for Children and Young People | 16 | 15 | -1 | 2 |
| Office of the Inspector of Custodial Services | 16 | 14 | -1 | -2 |
| Infrastructure WA (vii) | 14 | 13 | 0 | 13 |
| Office of the Information Commissioner | 13 | 12 | 2 | 1 |
| Keep Australia Beautiful WA | 11 | 10 | 1 | 1 |
| Burswood Park Board | 7 | 5 | 0 | 0 |
| Veterinary Surgeons' Board | 6 | 4 | 0 | 0 |
| Minerals Research Institute of Western Australia (MRIWA) | 5 | 5 | 0 | 1 |
| Architects Board of Western Australia | 2 | 2 | 0 | 0 |
| Salaries and Allowances Tribunal | 2 | 2 | 0 | -1 |
(i) The Department of Communities supports the Disability Services Commission (Headcount: 1,071; FTE: 911) and Housing Authority (Headcount: 1,870; FTE: 1,703) which remain statutory authorities.
(ii) Sworn officers are employed by the Police Force (a non-public sector entity as defined in the Public Sector Management Act 1994), separated from the Police Service.
(iii) The Department of Biodiversity, Conservation and Attractions includes the Botanic Gardens and Parks Authority (Headcount: 143; FTE: 101), Rottnest Island Authority (Headcount: 135; FTE: 115), and Zoological Parks Authority (Headcount: 205; FTE: 153) as part of administrative arrangements. However, these statutory authorities remain as separate entities and continue to employ their own staff.
(iv) While staff of regional development commissions are part of the Department of Primary Industries and Regional Development, regional development commissions and their respective chief executives and boards remain as separate entities under legislation. For the purposes of this report, the nine regional development commissions are included in the Department of Primary Industries and Regional Development.
(v) Energy Policy WA was established on 5 September 2019 as a new sub-department within the Department of Mines, Industry Regulation and Safety (DMIRS) and employee numbers are included within DMIRS for the purposes of this report.
(vi) Staff of the Metropolitan Redevelopment Authority are transitioning to WA Land Authority under the DevelopmentWA banner. WA Land Authority is a government trading enterprise, hence not captured in this report. This quarter 38 headcount (34 FTE) moved from Metropolitan Redevelopment Authority.
(vii) Infrastructure WA was established in July 2019 but had no employees in September 2019.