The data and analysis are for 2025 and, therefore, do not reflect the impacts of conflict in the Middle East on Western Australia’s (WA) resources sector. The conflict has already affected commodity prices and operating costs (from higher diesel, jet fuel, and chemical prices), leading to impacts on industry activity. The size of the impact remains dependent on the length, extent, and intensity of the conflict, which is highly uncertain.
In 2025, the Western Australian resources sector delivered $226 billion in revenue on mineral and petroleum sales and production, around the same overall level as recent years.
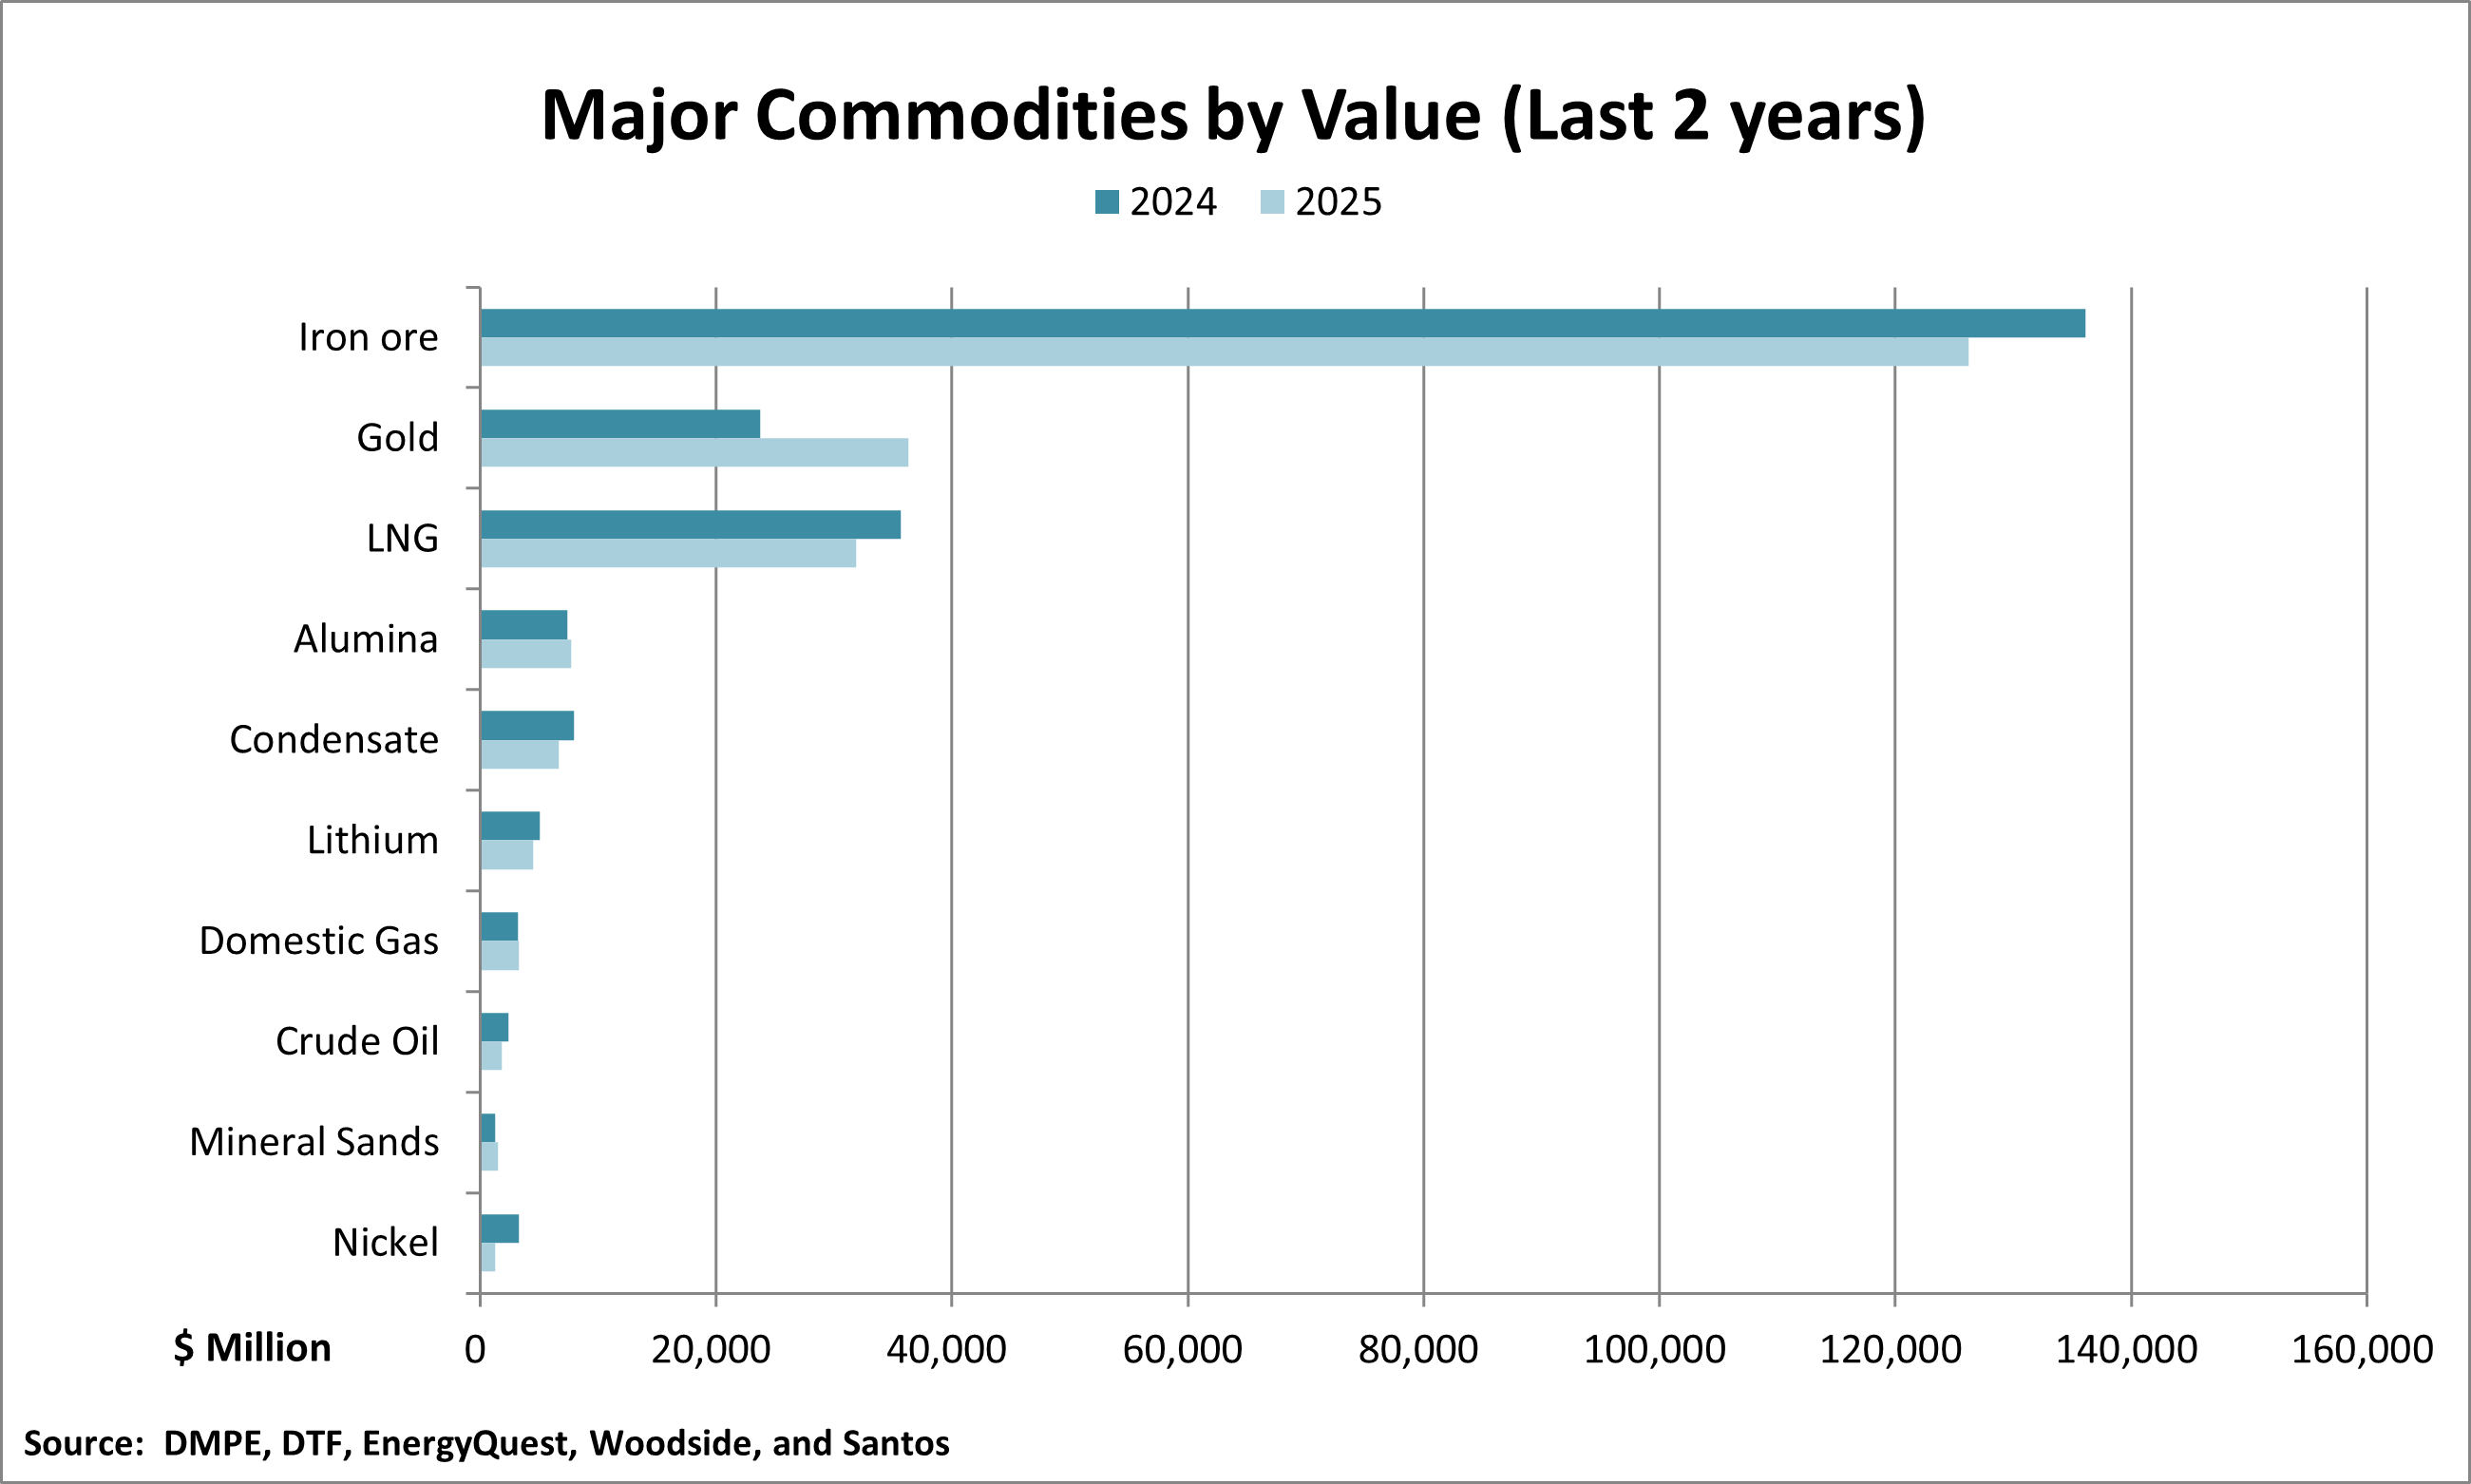
This is another strong result but is down from peak levels of more than $250 billion achieved during a period of record high liquefied natural gas (LNG) prices in the aftermath of escalation in the Russo-Ukrainian War, and the boom in lithium prices driven by heightened demand expectations.
The most notable results included:
- Iron ore: sales valued at $126 billion, supported by relatively stable prices and volumes at an all-time high of 889 million tonnes (Mt) dry.
- Gold: record sales revenue of $36 billion off the back of extraordinarily high prices and the continued rebound in sales volumes to 6.8 million troy ounces (212 tonnes), one of the highest levels since the 1990s technology driven surge. Gold is now the second most valuable commodity overall ahead of LNG.
- LNG and Condensate: sales of $32 billion and $6.7 billion, despite marginally softer prices and production.
- Alumina: alumina sales were $7.7 billion, similar to the prior year, due to a spike in prices in late 2024 carried over into early 2025. However, there were ongoing challenges for the industry with production at one of its lowest levels in two decades.
- Lithium: sales revenue was $4.5 billion with prices falling to some of the lowest levels in five years. However, a record level of almost 4Mt of spodumene concentrate was sold from and used in WA.
- Nickel: sales revenue was just $1.3 billion on less than 54 thousand tonnes (kt) of contained nickel sales. This is the lowest sales value for nickel since the 1990s and the industry’s revenue was less than that of mineral sands for the first time on record.
A marginally weaker Australian dollar assisted the sector once again, as most commodities are priced in US dollars with associated revenues converted back to Australian dollars. It averaged US 64 cents during 2025, down from US 66 cents in 2024, amid US tariffs and global economic uncertainty.
2025 Major Commodities data file
Minerals
Minerals production led the way once again for WA’s resources sector in 2025 with $182 billion in sales, around the same level as recent years.
Minerals made up 80 per cent of all resources sector sales, slightly higher than the 10-year average.
Iron Ore
- Value: $126 billion and the top commodity overall.
- Quantity: a record for a calendar or financial year of 889Mt dry tonnes, due to the ongoing ramp-up of Mineral Resources’ Onslow project, record shipments by Fortescue, a steady year from BHP, and an improved performance from Rio Tinto in the second half of the year.
- Prices: were relatively stable at an average of US$102 per tonne, compared to US$109 per tonne in 2024, on steady supply and stockpiling to support demand.
Gold
- Value: $36 billion, an all-time high.
- Quantity: increased to around 6.8 million troy ounces (212 tonnes), one of the highest levels since the 1990s, with local producers expanding output to take advantage of high prices. This included Telfer, which resolved earlier operational issues, following its acquisition by Greatland Gold, Ramelius Resources’ Cue due to higher ore grades and lower ore dilution, in addition to Genesis Minerals’ Gwalia and Mt Morgans operations supported by the restart of the Laverton mill ahead of schedule and the ramp-up of new mines.
- Prices: reached new heights averaging more than US$3,400 per ounce, benefitting from its safe-haven investment status in an environment of global tensions and economic uncertainty.
Lithium
- Value: sales revenue was $4.5 billion, among its lowest levels in five years and around one-fifth of the greater than $20 billion just three years ago.
- Quantity: a record of almost 4Mt of spodumene concentrate was sold from and used in WA with the ramp-up of Liontown Resources’ Kathleen Valley and Covalent Lithium’s Mount Holland projects. They offset production cuts at Mineral Resources’ Mt Marion project, plus the suspension of Rio Tinto’s Mt Cattlin and Mineral Resources’ Bald Hill operations.
- Prices: prices were at some of the lowest levels since early 2021 averaging US$838 per tonne due to market oversupply and lower than forecast demand for electric vehicles. However, positive market signals began to emerge in late-2025 driven by demand from battery energy storage systems.
Other Minerals
- Alumina: was relatively stable with $7.7 billion in sales, primarily from a price spike in late 2024 that carried over into early 2025. However, there were ongoing challenges for the industry with production at less than 11Mt, one of its lowest levels in two decades. Production was impacted by the curtailment (and subsequent closure) of Alcoa’s Kwinana refinery and bauxite access and quality issues.
- Mineral Sands: $1.5 billion in revenue (the highest on record), primarily from higher ilmenite and zircon output associated with Sheffield Resources’ Thunderbird (despite operational challenges) and the ramp-up of Image Resources’ Atlas project. This was despite ongoing operational challenges at Coburn that resulted in previous owner Strandline Resources entering voluntary administration, with the project suspended and subsequently acquired by Doral Mineral Sands.
- Nickel: with market conditions weak from a supply surplus driven by Indonesia and several local operations subsequently suspended, most notably BHP’s Nickel West, sales revenues were just $1.3 billion on less than 54kt in contained nickel sales. This is the lowest sales value for nickel since the 1990s and the industry’s revenue was less than that of mineral sands for the first time on record.
- Copper: despite record prices, had just $1 billion in revenue which is one of the lowest points since the Global Financial Crisis. This was due to the lack of primary copper production in WA following Sandfire Resources’ DeGrussa project reaching the end of its life, and lower copper by-product production from gold operations and the suspension of several nickel operations.
- Rare Earths: there were 34.1 million kilograms of rare earth oxides (contained in concentrate and carbonate) produced from Lynas Rare Earths’ operations, a record amid improved market conditions and despite power supply issues in Kalgoorlie towards the end of the year.
- Salt: $755 million in revenue, down from $803 million in 2024, and record production of 12.4Mt.
- Coal: $529 million in revenue (the highest on record) and production of 5.6Mt (the highest in five years).
- Manganese: $369 million in revenue, down from $427 million in 2024, and the highest quantity in more than a decade of 607kt.
- Construction materials: $243 million, one of the highest levels on record.
- Silver: $224 million in revenue, a new high, driven by record prices.
- Lead: a historical high of $223 million from higher volumes of 72kt due to improved production from Endurance Mining’s Abra operation.
- Cobalt: $168 million, well down from a record $525 million in 2022, with reduced by-product production following the suspension of several nickel operations.
Petroleum
WA’s petroleum sector achieved production valued at over $44 billion in 2025.
While still at a high level by virtue of the industry’s scale, it is down from $50 billion in 2024 and earlier record levels of more than $70 billion during a period of extraordinary prices.
Petroleum accounted for 20 per cent of total mineral sales and petroleum production from WA in 2025, which is slightly lower than the 10-year average.
Liquefied natural gas
- Value: $32 billion, well down from the record of $57 billion in 2022-23 but still high, historically.
- Quantity: 44Mt, down marginally from around 48Mt in recent years. There was reduced capacity at the North West Shelf following the retirement of one processing train and declining gas supply, as fields were depleted. Prelude was affected by a combination of severe weather impacts, unscheduled maintenance, and power system failures.
- Prices: softer but broadly steady year-on-year, at around US$10 per Million British thermal units, with improved supply and relatively weak Asian demand being offset by ongoing macroeconomic uncertainty.
Condensate
- Value: $6.7 billion, down from $7.9 billion in 2024 and earlier record levels of more than $9 billion but still high, historically.
- Quantity: 10.1 gigalitres (GL), the lowest level since 2019 with lower output from the North West Shelf and Prelude (described above).
Domestic gas
- Value: reached a record high of $3.3 billion.
- Quantity: was stable at a high level of 11.6 billion cubic metres. There was lower output from Gorgon due to scheduled downtime, but this was offset by increased production from Santos with a successful John Brookes well intervention campaign, steady production from Halyard-2, and improved reliability at Varanus Island.
- Prices: increased to an average of $7.4 per gigajoule in line with inflation as the domestic market was broadly balanced.
Oil
- Value: $1.8 billion and its lowest point in five years.
- Quantity: 2.6GL, the lowest level since the late 1980s, reflective of a broader structural decline that has seen output more than halve over the past decade. The Chevron-operated Barrow Island oil project ceased production effective from May 2025, while Santos’ Van Gogh project ceased production in July 2025.
- Prices: were at the lowest point since the COVID-19 pandemic in 2020, at an average of US$69 per barrel, on concerns over oil demand amid geopolitical and trade tensions, and weak economic growth.