National Metrics about Information Access Rights
In 2017, Australian Information Access Commissioners and Ombudsmen released the inaugural dashboard of metrics on public use of freedom of information access rights, fulfilling a commitment made in the Open Government National Action Plan.
The metrics for each jurisdiction reflect current available data that is reasonably comparable across jurisdictions. The metrics for WA are compiled from the agency statistical data provided to this office each year.
The National Metrics are available at Dashboard and metrics on the public's use of FOI laws. The dashboard includes data from 2014-15 to 2023-24.
Development of the National Metrics
Under Commitment 3.2 of Australia's first Open Government National Action Plan 2016-2018, the NSW Information Commissioner led work by Australian Information Commissioners and Ombudsmen to develop (within the remit of their jurisdictions) uniform metrics on public use of freedom of information access rights and the collection and publication of this data. The objective was that Australia will better measure and improve our understanding of the public’s use of rights under freedom of information laws.
The scope of the metrics covers:
- Type of applicant
- Application rates per capita
- Release rates
- Refusal rates
- Timeliness
- Review rates
In line with the milestones for Commitment 3.2 detailed in the National Action Plan, NSW lead a validation and pilot process for data collection and presentation, for release of the first data report using the metrics.
The National Metrics are not all directly comparable to the statistics published about agency applications in the OIC annual report. The raw data from the statistical returns is used to calculate each metric so as to link similar applications, and outcomes that are reasonably comparable across jurisdictions.
For example, in the National Metrics, the reported number of access applications where access is refused in full does not include those where there was a decision made under section 26 of the FOI Act to refuse access (on the basis that the documents cannot be found or do not exist). This is because not all jurisdictions have the equivalent of a section 26 decision available in the jurisdiction.
WA Metrics - 2019-2020 to 2023-2024
| Description | 2019-2020 | 2020-2021 | 2021-2022 | 2022-2023 | 2023-2024 | |
|---|---|---|---|---|---|---|
| Metric 1 | Number of formal applications received by agencies | 18,392 | 20,354 | 21,169 | 21,241 | 22,227 |
| Metric 2 | Formal applications received per capita | 6.9 | 7.6 | 7.6 | 7.4 | 7.5 |
| Metric 3 | Percentage of all decisions made on formal applications where access was granted in full or in part | 91% | 92% | 91% | 93% | 93% |
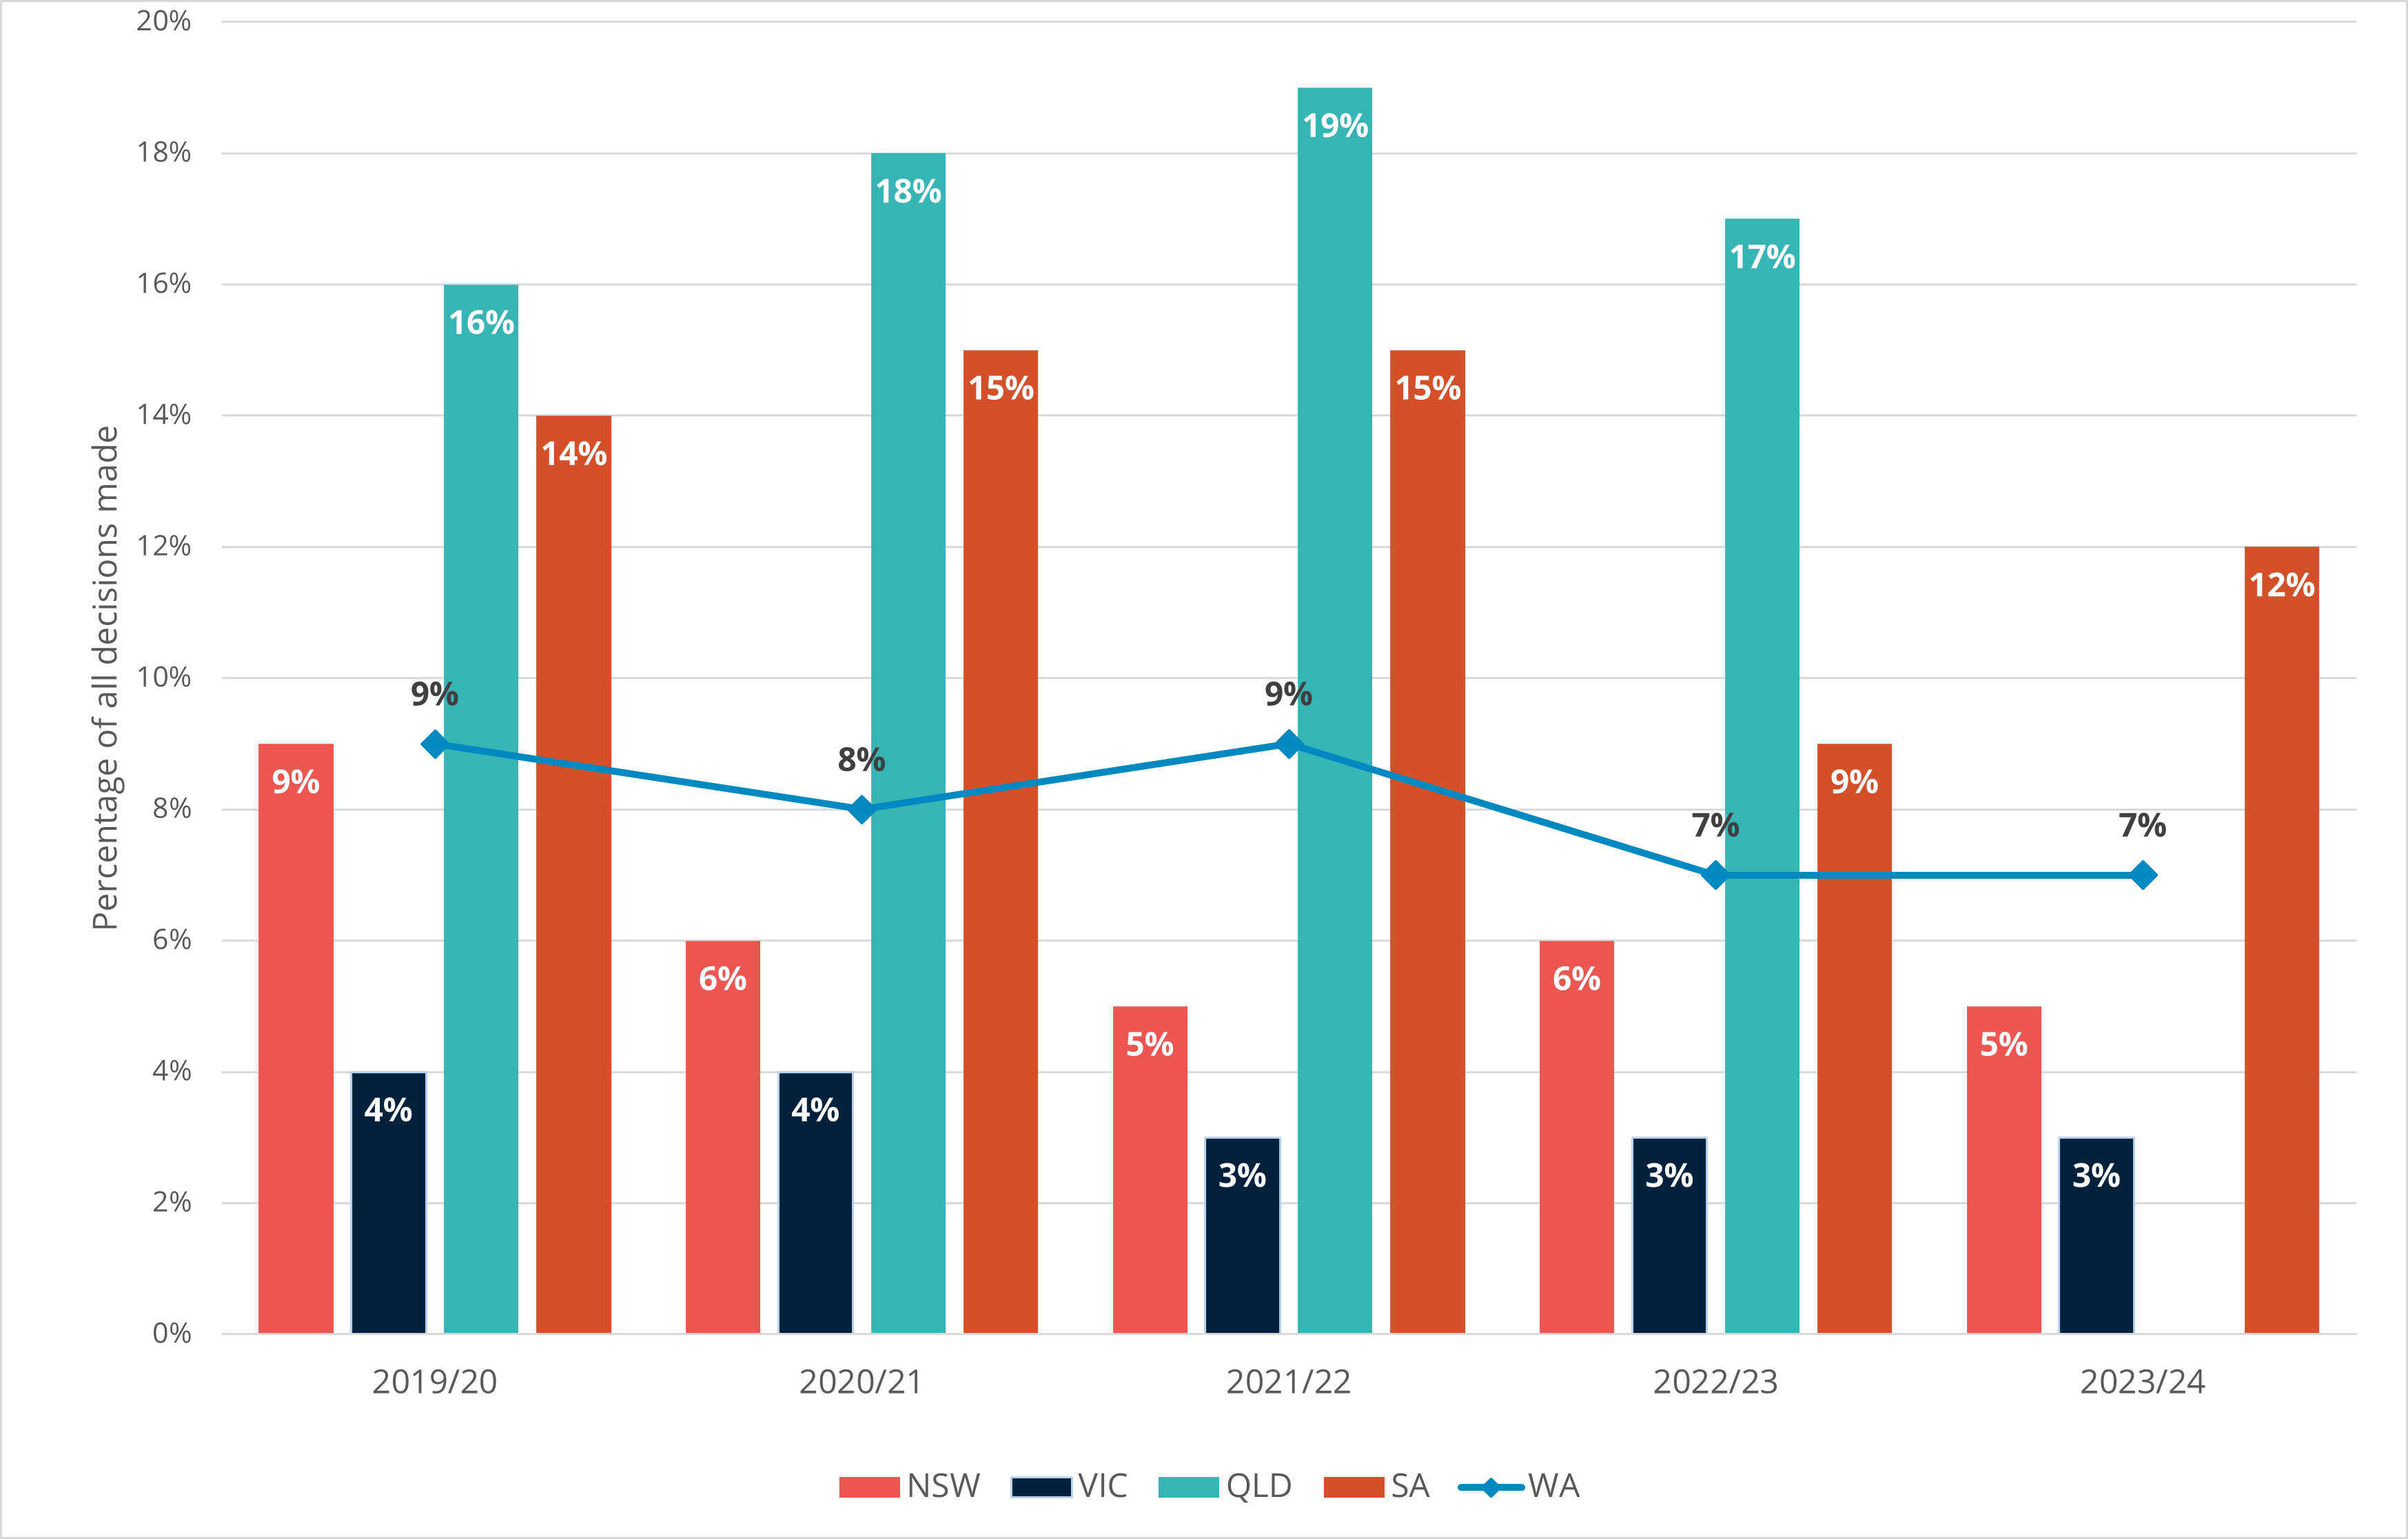
| Metric 4 | Percentage of all decisions made on formal applications where access was refused in full | 9% | 8% | 9% | 7% | 7% |
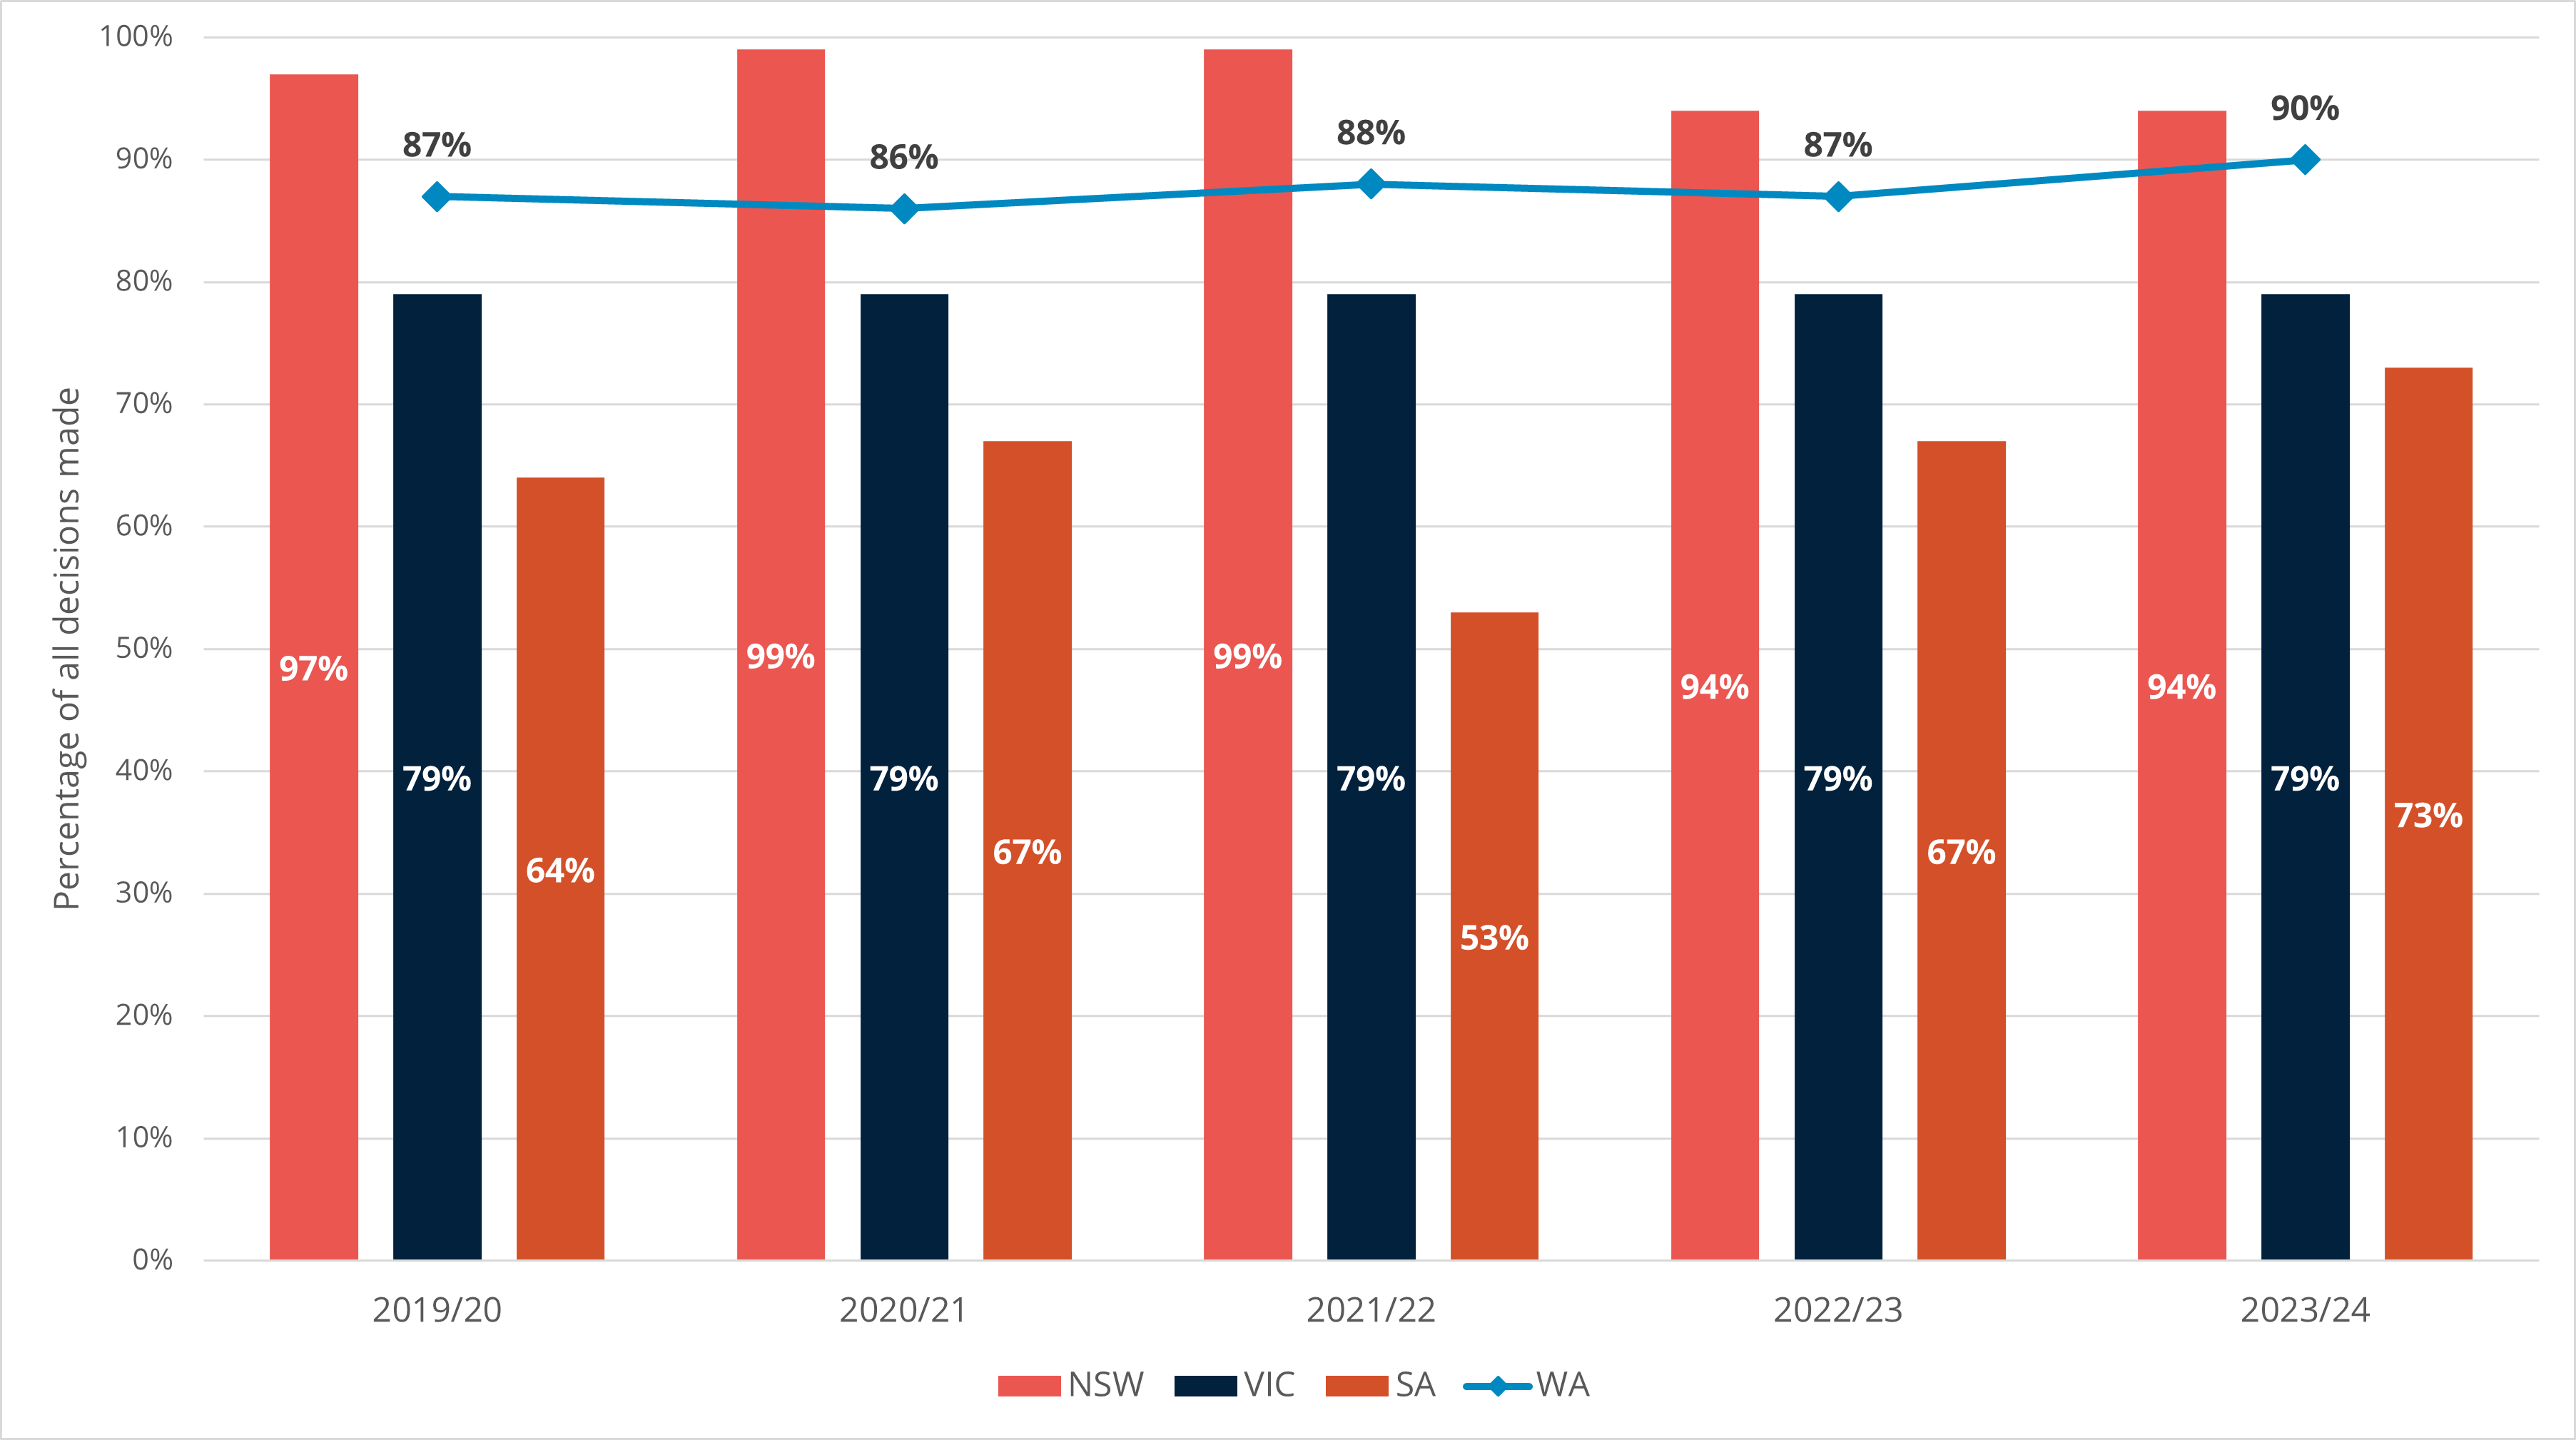
| Metric 5 | Percentage of all decisions made within the statutory time frame | 87% | 86% | 88% | 87% | 90% |
| Metric 6 | Percentage of applications received which are reviewed by the jurisdiction Information Commissioner /Ombudsman | 0.9% | 0.8% | 1.0% | 0.70% | 0.07% |
What the data says about information access in WA in 2023-2024
The data from the 2023/24 dashboard indicates that West Australia agencies:
- received the second highest number of access applications per capita, alongside South Australia. South Australia and Western Australia have been surpassed by Victoria;
- had the third highest percentage of access provided in full or in part (93%);
- dealt with 90% of access applications within the statutory timeframe provided by the FOI Act; and
- had the lowest percentage of external reviews received, as a percentage of the total number of access applications received by agencies.
Considering the National Metrics over the last five years
The charts below show how WA compares with four other State jurisdictions (excluding Tasmania, the Northern Territory and the Commonwealth). This provides a closer comparison of similar jurisdictions that receive the highest number of applications.
Metric 2 - Formal applications received per capita 2019-2020 to 2023-2024
Metric 3 - Percentage of all decisions made on formal applications where access was granted in full or in part 2019-2020 to 2023-2024
Metric 4 - Percentage of all decisions made on formal applications where access was refused in full 2019-2020 to 2023-2024
Metric 5 - Percentage of all decisions made within the statutory timeframe 2019-2020 to 2023-2024
Metric 6 - Percentage of applications received which are reviewed by the jurisdiction Information Commissioner/Ombudsman 2019-2020 to 2023-2024