What is the Climate Science Initiative and why is it important?
Show moreClimate change poses significant challenges for communities in Western Australia (WA) who are experiencing more extreme weather events such as tropical storms, floods and bushfires. The State Government is supporting businesses, communities and local governments to understand the future climate and adapt to the impacts of climate change.
The CSI is developing climate projections for WA at 20-km and 4-km resolution in partnership with the NSW Government’s Department of Climate Change, Energy, Environment and Water, Murdoch University and WA’s Pawsey Supercomputing Research Centre.
The climate projections will represent our best understanding of WA’s future climate to 2100. The projections will support government agencies, businesses and individuals to prepare for events such as storms, floods, bushfires, and heatwaves, and protect WA’s unique biodiversity.
How are climate projections developed and why do we need them?
Show moreA global climate model (GCM) is a computer simulation of the Earth’s climate system based on real data. GCMs represent processes and interactions that drive the Earth’s climate and help us to understand changes resulting from activities such as burning of fossil fuels. The coarse resolution of GCMs (from 100 to 250 km) limits their ability to examine the impacts of climate change on local regions or towns.
The CSI will give us a better understanding of climate change at a local level by producing climate projections at smaller scales (20 km and 4 km resolution). At these scales, regional influences like topography, land use and coastlines can be better understood, as well as extreme events like storms. The figures below illustrate the improved resolution with a 4 km grid cell size.


Figure 1 Example of land use in a global climate model demonstrating the resolution difference with grid cell size


Figure 2 Example of topography in a global climate model, which also shows the need for downscaled regional models
Modelling at this scale has never been carried out for WA. It will represent our best understanding of how the climate will change over the next 75 years, using a range of important climate variables, including rainfall, temperature, humidity, and air/wind speed.
What will climate projections tell us about the future climate?
Show moreClimate projections will help government and industry manage the risks associated with climate change by providing robust future climate scenarios.
The projections will provide an overview of how conditions will change on average in a region over the coming decades (for example, the likely change in daily maximum summer temperatures in Joondalup by 2050). The projections will also provide vital information on climate extremes including the number of very hot days, severe fire danger days, drought duration and intensity of rainfall events.
The CSI will help answer questions like:
- What risks does climate change pose to specific regions?
- What impact can we expect on rainfall and regional water supplies?
- How will cyclones and tropical storm patterns change?
- What will be the change in fire risk in the southwest?
It is important to note that climate projections involve uncertainties due to the complexity of the Earth’s climate system and future greenhouse gas levels. CSI will synthesise and present the best available scientific information to support decision making.
Where can I find credible information about CMIP 6 and climate modelling?
Show moreCMIP6 models represent a new generation of climate models. For more information see our explainer on the latest in climate modelling: Everything you need to know about the latest in climate modelling factsheet.
For further information about CMIP6 and climate modelling in general:
- Fact sheets and reports on CMIP6 models from the National Environmental Science Program’s Climate Systems Hub: How have the latest global climate models improved? - NESP 2 climate
- Climate explainers from NSW: Climate projections used on AdaptNSW | AdaptNSW
- Australian Climate Service information on climate modelling: Climate modelling | Australian Climate Service (acs.gov.au)
- The ARC Centre of Excellence for Climate Extremes | Climate modelling - an overview - The ARC Centre of Excellence for Climate Extremes
- CMIP6: the next generation of climate models explained - Carbon Brief
- Climate Explainers from QLD: | LongPaddock | Queensland Government
- Climate Change in Australia information and projections: Home (climatechangeinaustralia.gov.au)
Who should use the Climate Science Initiative projections?
Show moreWhen will Western Australian climate projections become available?
Show moreStatewide temperature and rainfall climate projections for the whole of WA at a grid resolution of 20 km are now available for technical users from the Shared Location Information Platform (SLIP) | Data WA.
Projections at a grid scale of 4 km are anticipated to be available for the South West in early 2026 and for the North West, covering the Pilbara and Kimberly regions, in late 2026 (Figure 3). An online climate viewer map is in development and will visualise the projections for non-technical users. It is expected to be available by the end of 2026.
Producing local climate projections is complex, highly technical work and is being undertaken for the first time in WA. The cutting-edge nature of this work involves solving tens of thousands of equations at every single grid point and timestep which represents WA’s regional climate.
The department will provide regular updates on delivery timeframes for climate projections as the project progresses.

Figure 3 Map of WA showing the CSI’s southwest and northwest regions for the delivery of 4 km climate change projections
What global climate models are being used by the Climate Science Initiative and how were they chosen?
Show more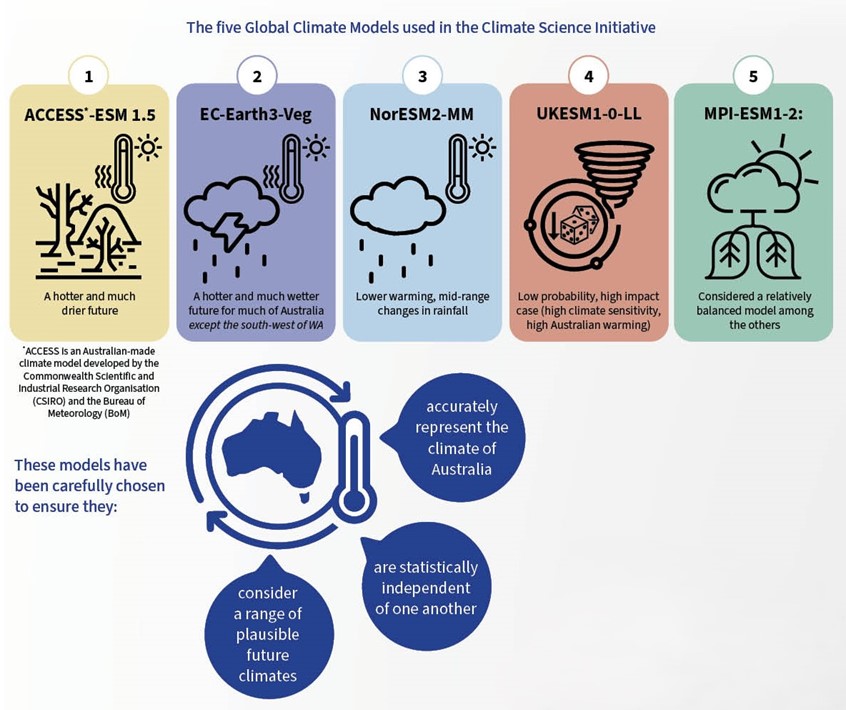
- Peer-reviewed literature on the GCM selection process is published in Earth’s Future.
- Peer-reviewed literature on the RCM selection process is published in Geoscientific Model Development.
Will the Climate Science Initiative model sea level rise and coastal erosion risk?
Show moreWhat climate projections should I use while the CSI projections are being developed?
Show moreThere is a wide variety of climate projection datasets currently available, and the right choice depends on the user's needs. Visit our guide to climate science resources for Western Australia for a list of resources currently available, including consideration of other sources of climate projection data.
Which emissions scenario should I consider?
Show more- Increase in global average temperature of 1.5°C above pre-industrial levels; and
- Increase in global average temperature well exceeding 2°C above pre-industrial levels (meaning an increase of 2.5°C or higher).
What are the differences between the newer CMIP6 models compared to the previous CMIP5 models?
Show more- improved representation of key processes
- higher resolution, and
- the inclusion of additional Earth system components.
Why is the CSI modelling different scenarios? What emissions scenarios have been used to produce the projections and why?
Show more- a low emissions scenario where temperatures increase by about 1.8°C by 2100 (SSP1-2.6). This scenario envisions a low-emissions future with a global transition towards sustainability, including stringent environmental policies and sustainable practices, leading to lower global greenhouse gas emissions.
- a medium emissions scenario where temperatures increase by about 2.7°C by 2100 (SSP2-4.5). This scenario is an intermediate greenhouse gas emissions scenario where global efforts to reduce emissions are moderately successful. Some regions may adopt sustainable practices and technologies, while others continue with higher emissions, leading to moderate climate changes.
- a high emissions scenario where temperatures increase by about 3.6°C by 2100 (SSP3-7.0). This scenario is marked by high population growth, limited regulations, and where countries do not collaborate on tackling climate change, resulting in elevated greenhouse gas emissions and a more severe impact on the climate.
| Mid term, 2041–60 | Long term, 2081–2100 | ||||
| SSP | Scenario | Best estimate (°C) | Very likely range (°C) | Best estimate (°C) | Very likely range (°C) |
| SSP1-2.6 | Low GHG emissions | 1.7 | 1.3 – 2.2 | 1.8 | 1.3 – 2.4 |
| SSP2-4.5 | Intermediate GHG emissions | 2.0 | 1.6 – 2.5 | 2.7 | 2.1 – 3.5 |
| SSP3-7.0 | High GHG emissions | 2.1 | 1.7 – 2.6 | 3.6 | 2.8 – 4.6 |
Table 1 Shared socioeconomic pathways used in CSI
How do the CSI projections differ from other climate projection data sets?
Show more| CSI projections | National Hydrological Projections 1.0 | Climate Change in Australia (CCiA) | Australian Climate Service[1] (in development) | |
| CMIP generation and global climate models (GCMs) | CMIP6 5 x GCMs | CMIP5 4 x GCMs | CMIP5 CMIP3 Up to 40 GCMs | CMIP6 |
| Regional climate models | WRF | Conformal-Cubic Atmospheric Model (CCAM) | Statistical downscaling used (limited RCM information) | CCAM Bureau of Meteorology Atmospheric Regional Projections for Australia (BARPA) |
| Grid resolution | 20 km 4 km (in development) | 5 km | Various | BARPA 17 km / CCAM 11 km – both statistically interpolated to 5 km |
Products will be released over time so consider further information when it is available. For example, you may use the 20-km CSI projections until the 4-km CSI projections become available.
What do I use for water applications, such as the Bureau of Meteorology’s National Hydrological Projections (NHP)?
Show more
How do I access the new dataset available on SLIP/Data WA and what formats is the dataset available in?
Show more- CSV (Excel)
- Shapefile
- NetCDF
- Geodatabase
A technical fact sheet is also available on the SLIP to assist users to utilise the data.
How many years of data are available and what is the baseline?
Show moreWhat is coming next for WA? What is the difference between the 20km and 4km data?
Show moreThe projections at a grid scale of 4 km are anticipated to be available for the South West in early 2026 and for the North West, covering the Pilbara and Kimberley regions, in late 2026.
How are local climate projections developed and why do we need them?
Show moreCSI’s projections are being developed by scientists in the Department of Water and Environmental Regulation (the department) and Murdoch University’s Centre for Atmospheric Science. The projections are being produced in WA on one of the world’s most powerful supercomputers, the Pawsey Supercomputing Research Centre.
Global climate model information is processed in partnership with the NSW Department of Climate Change, Energy, the Environment and Water, via the NSW and Australian Regional Climate Modelling (NARCliM) program. This partnership provides the 20 km source data for further processing by the department and Murdoch University scientists to create the 4 km projections for WA.
The CSI follows the Coordinated Regional Climate Downscaling Experiment (CORDEX) design for downscaling to 4 km resolution. This is international best practice. For WA, the model is validated using historical datasets from weather stations across the state, as well as reputable weather forecasting models (i.e. ERA5 and WRF), to ensure outputs are as accurate as possible.
The coupled model intercomparison project (CMIP) provides a framework to analyse and validate GCM outputs. Its latest version, CMIP6 is used in the CSI and provides:
- an improved representation of climate processes
- higher resolution, enhanced simulation of extreme events
- better uncertainty quantification
- incorporation of Earth system components
- integration of cutting-edge scientific advancements.
CMIP6 models represent a new generation of climate models and are highlighted in the most recent report from the Intergovernmental Panel on Climate Change (released in sections from 2021 to 2023).
For more information on:
- The latest in climate modelling see: Everything you need to know about the latest in climate modelling
- The department and NARCliM partnership see: New partnerships boost climate science capability
- The NARCLiM project:
What are the advantages of using dynamically downscaled models produced by the Climate Science Initiative?
Show more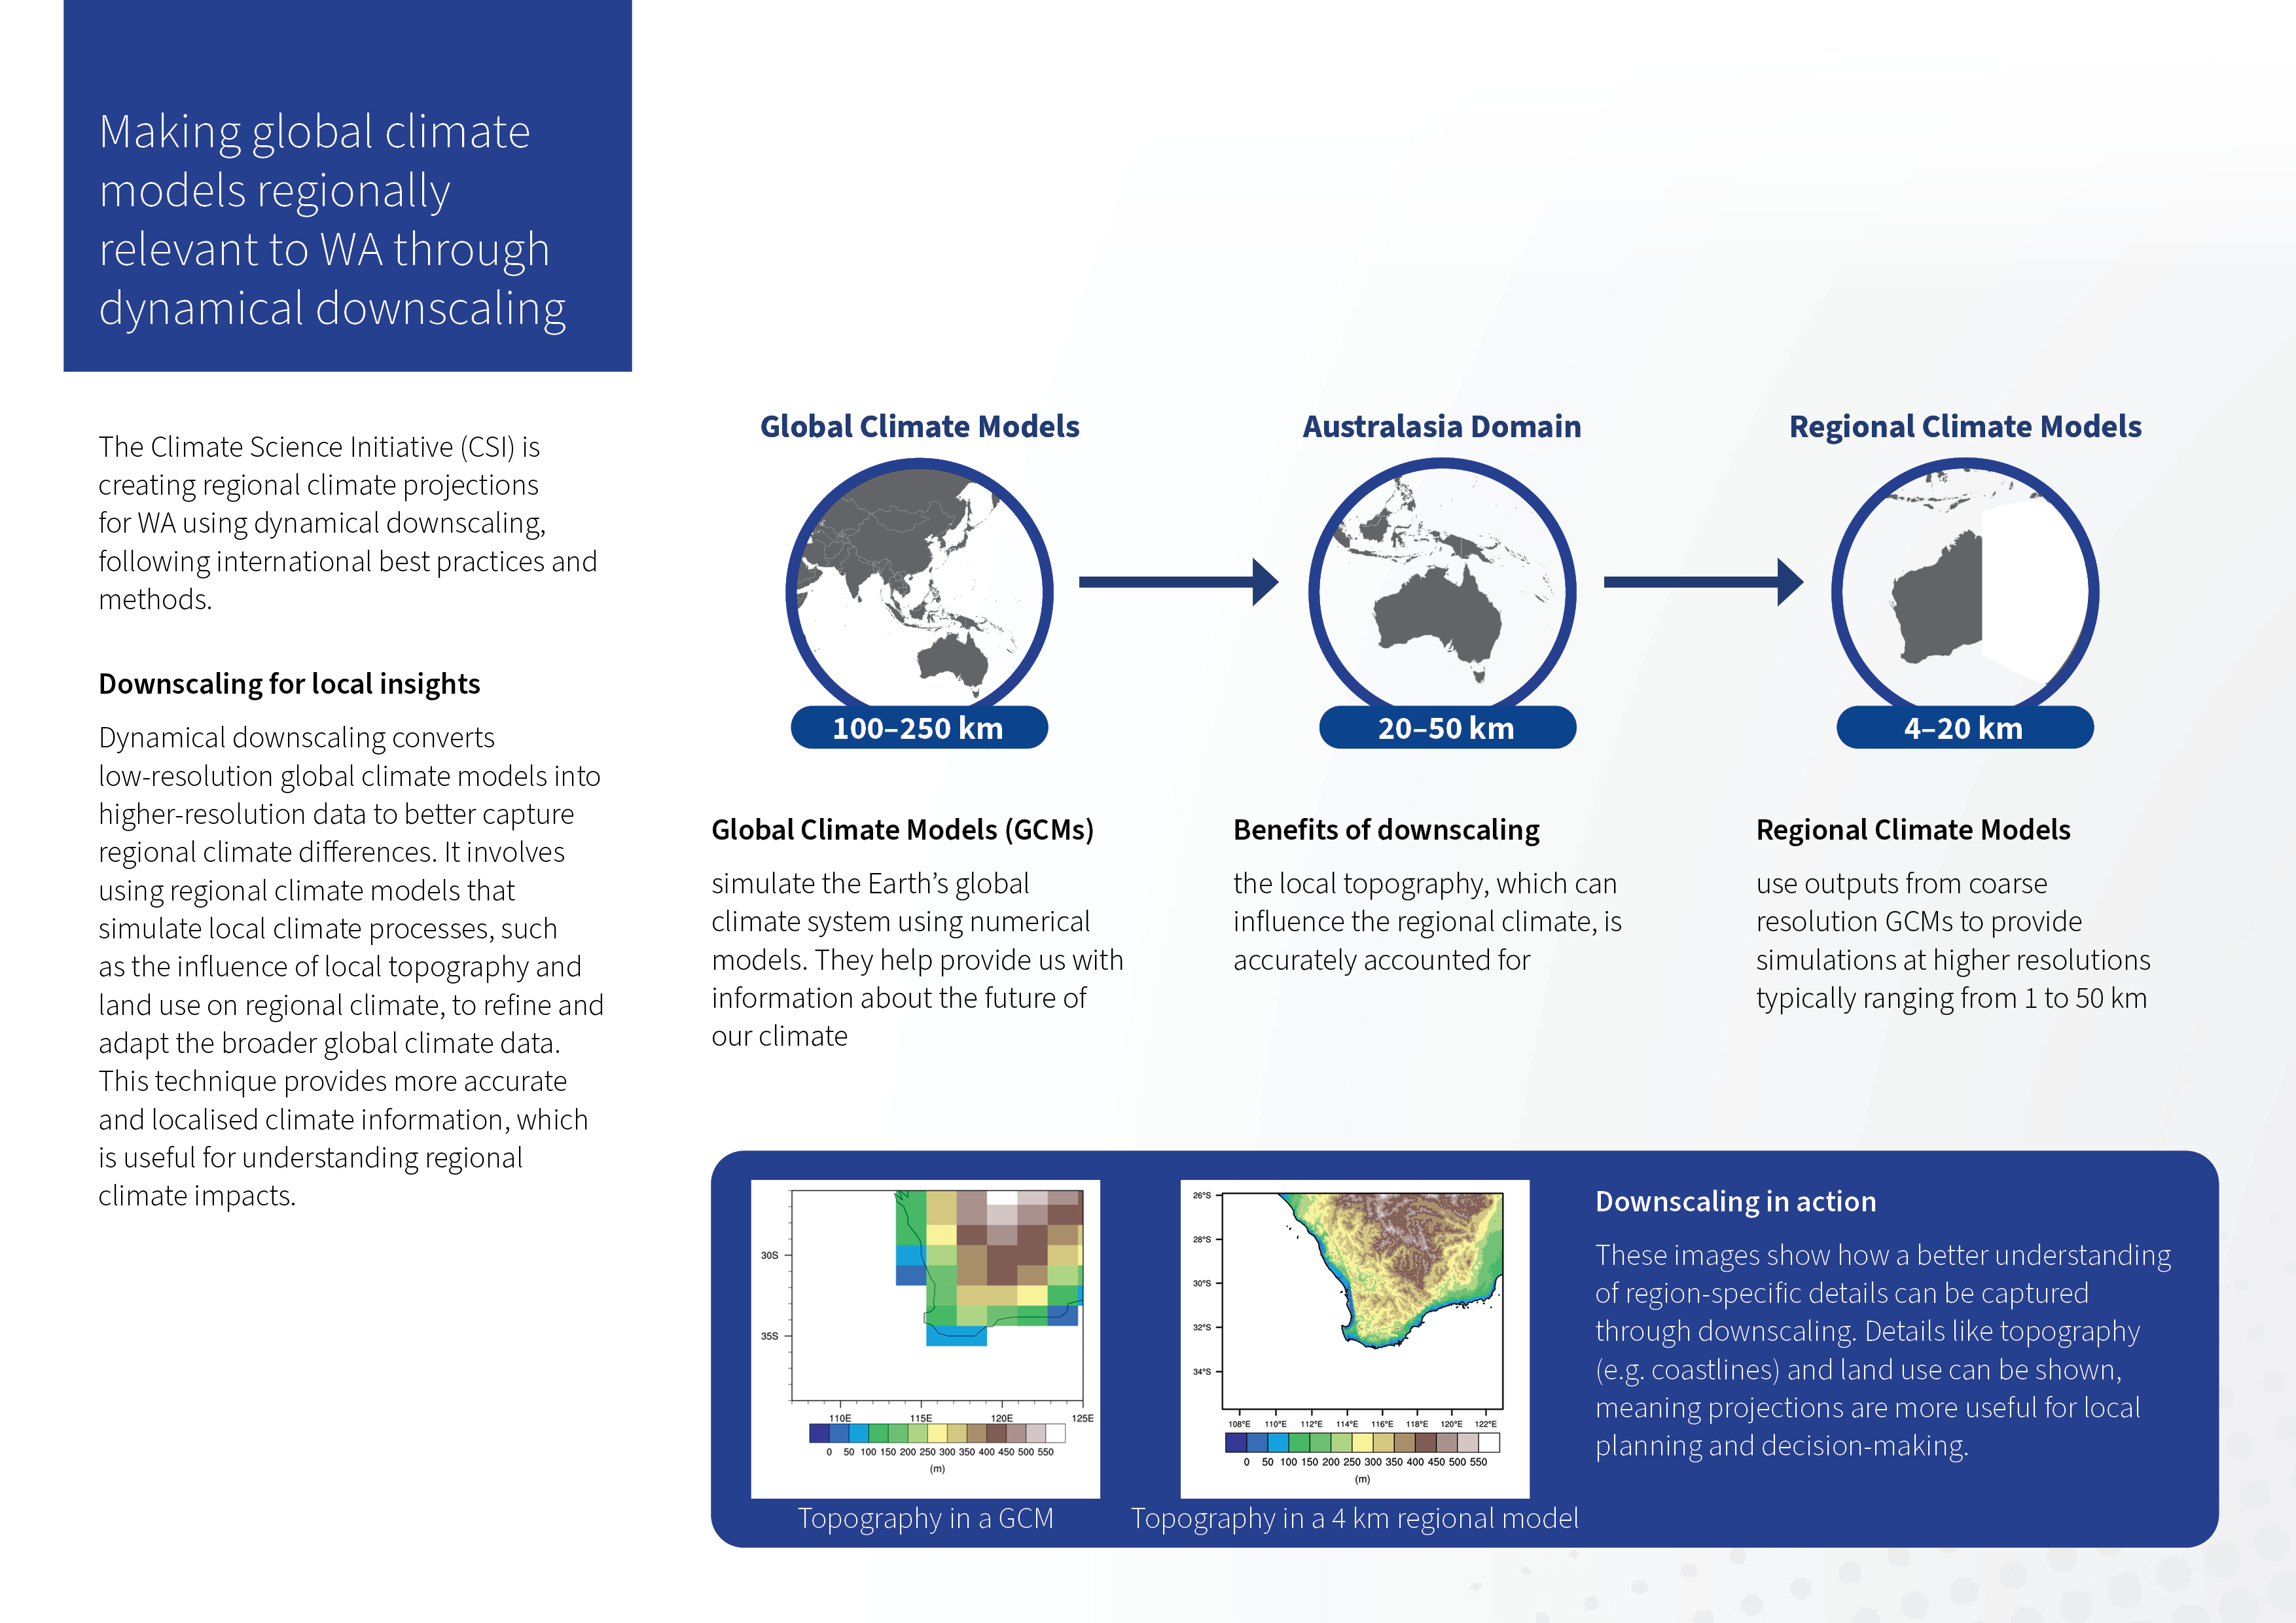
- Article on the difference between dynamical and statistical downscaling from the ARC Centre of Excellence for climate extremes.
How should I use the climate projections effectively, and what are some common pitfalls to avoid?
Show more- For each regional climate model, we recommend using the full range of projections data available, i.e., all CMIP6 models downscaled, and all available future climate scenarios (SSPs). This will provide a solid evidence base to assess the impacts of climate change for risk assessments or other decision-making activities.
- It is not recommended to use the output from only 1 regional model, i.e., downscaling a single CMIP6 GCM for one particular future climate scenario. This can be misleading because climate projection data varies depending on the climate model and scenario selected. Different models and scenarios will produce slightly different outcomes, so a range is recommended to capture this uncertainty.
- Uncertainties will always exist within the modelling due to climate variability and emissions uncertainty, so there are model-to-model differences. While climate projections provide a solid evidence base, they should be used as a guide to the future, and changes above or below the projected range should still be considered when managing risk.
- We generally do not recommend using data from a singular grid point when using the climate projections data. Rather you should use a region of interest large enough around the point of interest. If data from a single grid point is used, it is very important to check if this grid point is over land or the ocean if the location is close to the coast. It is also critical to check the dominant land-use type at that grid point as it may not necessarily correspond exactly to the actual land-use at that point in the real world.
Are there any limitations of CMIP6 models I should be aware of?
Show more- Some regional biases remain, for example excessive rainfall over the warm tropical seas in south east Asia (see the Maritime Continent) and rainfall pattern biases in the nearby tropical convergence zones (Grose et al., 2020).
- Simulations of large-scale climate drivers and Australian rainfall could be further improved (Grose et al., 2020 and Di Virgilio et al., 2022).
- Grid point values over water bodies are often not representative of land areas due to differences in physical properties and climate influences between land and water. Therefore, values from cells centered over major water bodies were excluded. Removing these values helps ensure that the data used for land-based climate modelling is more accurate and relevant.