Many different sources of climate data and information have been developed and released over recent years. These resources have been designed for specific purposes or audiences, and present information in different ways. As a result, it can be confusing to select the best information for your needs from the different sources of climate science information.
While each information source has value, focusing your attention on a small set of the most useful resources for your purpose can save a lot of time, effort and potential confusion.
This guide will help you to:
- navigate a variety of climate information sources using a simple catalogue of resources
- identify those that are most relevant for your application within Western Australia (WA)
- provide a simple way to filter the available information sources and select the best one for your intended use.
This guide was developed through the Climate Science Initiative with the assistance of the National Environmental Science Program’s Climate Systems Hub. The Hub provides several resources that include important background and explain common terminology used in climate science.
A catalogue of climate science information
This catalogue lists the main resources currently available that deliver information relevant for Western Australia. It is important to note that work is underway to update these resources or develop new ones that use the latest generation of global climate models from the sixth phase of the global Coupled Model Intercomparison Project (CMIP6), including the Australian Climate Service and WA’s own Climate Science Initiative. This catalogue will be updated as new resources become available.
Western Australian tools and information
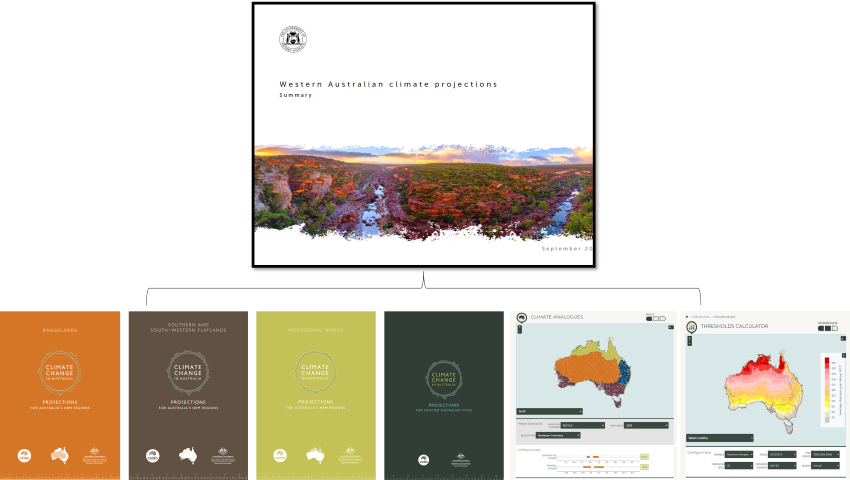
Show moreThe Western Australian climate projections: Summary was released in September 2021 to support high-level or first-pass climate risk assessments and adaptation planning. The information is drawn from the projections and tools available on Climate Change in Australia for three emissions scenarios (RCP 2.6, RCP 4.5 and RCP 8.5 developed using the previous CMIP5 model simulations) and for the most commonly requested climate variables, including temperature, number of days above 40°C, rainfall, frost, rainfall intensity, water supplies, cyclones, wind speed and fire risk.
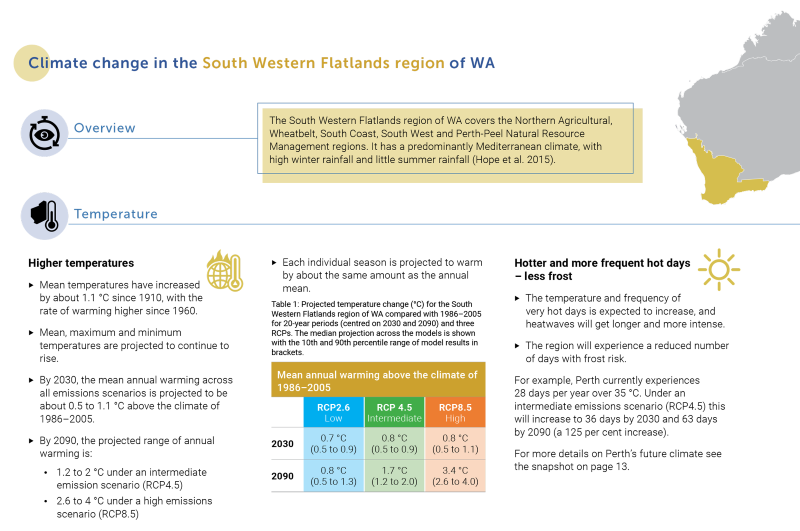
The Western Australian Climate Projections Summary provides easy-to-interpret summary information of climate projections for WA's major geographic regions.
The Climate Science Initiative will deliver additional WA-specific tools and services, including updated summary information, in the coming year based on the latest climate science.
National climate projection information
Show moreThe National Climate Risk Assessment (NCRA) provides a nationally consistent assessment of climate risks in Australia. This includes risks to communities, the economy, infrastructure and the natural environment, across various sectors, regions and systems. The information in the NCRA can be used to support high level decision making. It provides an Australia-wide view of climate that can be used alongside other Western Australia specific tools, such as the Climate Science Initiative climate projections.
A National Adaptation Plan (NAP) has also been prepared, and sets out the framework for the Australian Government to prepare for and respond to nationally significant climate risks, by providing a framework to prioritise adaptation actions based on the NCRA.
The Australian Climate Service (ACS) website provides information on the NCRA and the NAP as well as guidance on how climate science can be applied to support policy, planning and risk management across Australia. The ACS website helps users understand how national climate science products relate to one another and how they can be used alongside state‑based and sector‑specific tools.
This includes other information on hazards, risks and a data explorer visualisation tool. The tool enables comparison of hazards across different global warming levels (1.2°C, 1.5°C, 2°C and 3°C) or equivalent sea level rise increments for coastal hazard variables.
Climate Change in Australia (CCiA) provides a platform to access climate summary information and projection data for all of Australia. The CCiA resources were developed by CSIRO and the Bureau of Meteorology and are broadly applicable across a wide range of sectors and applications. The data presented on CCiA is based on models from the fifth generation of global climate models (CMIP5) for up to four future greenhouse gas trajectories described by Representative Concentration Pathways (RCPs).
CCiA includes a range of tools that allow access to information of differing levels of complexity or to suit different purposes:
- The Regional Climate Change Explorer provides summary information on future climates at a regional level for a subset of climate variables.
- The climate Analogues Explorer matches the proposed future climate of a location of interest with the current climate experienced in another location, using annual average rainfall and maximum temperature. This helps people visualise a possible future based on their own knowledge or experience of a different location.
- The Summary Data Explorer provides an interface to explore the projected changes in eight climate variables as bar charts or to download a table of the underlying data.
- The Extremes Data Explorer provides access to projections data for six different measures of extremes in temperature and rainfall.
- The Thresholds Calculator allows you to explore projected changes in maximum and minimum temperature above and below defined thresholds.
- The Map Explorer provides a way to visualise projected changes in climate variables for different regions, time periods, emissions scenarios and for sets of individual climate models.
- The Climate Futures tool is a multipurpose resource to assist the understanding and application of climate change projections for impact assessment and adaptation planning. This tool includes projections from global and regional climate models as well as statistically downscaled data. The tool provides flexible access to projected changes in up to 16 climate variables, 14 future time periods (5-year increments to 2090) and four emissions scenarios (RCP2.6, RCP4.5, RCP6.0 and RCP8.5).
- The Download NRM Datasets page provides access to application-ready projections data for Australia’s natural resource management regions. Data include 20-year averaged monthly, seasonal and annual changes for four time periods centred on 2030, 2050, 2070 and 2090 and for four greenhouse gas scenarios (RCP2.6, RCP4.5, RCP6.0 and RCP8.5).

The Map Explorer tool available on Climate Change in Australia.
Other Australian climate resources
Show moreState of the Climate is produced every two years by CSIRO and the Bureau of Meteorology. It provides an overview of the latest knowledge on how the climate is changing and how it will continue to change in the future. The report draws on a range of national and international sources, national projections data and information provided through the Climate Change in Australia website and past observational data from the Bureau of Meteorology.
Climate Science and adaptation training is available through a video series covering climate essentials, climate projection science and the impacts of Australia's changing climate on various sectors. There is also some useful content on adaptation for policymakers and practitioners.
The ARC Centre of Excellence for Climate Extremes (CLEX) is an international research consortium of five Australian universities and partner organisations, supported by the Australian Research Council (ARC). CLEX supports a comprehensive climate research program and produces reports and briefing notes on extreme events to support decision-making by governments and industry. CLEX has produced excellent resources to explain how climate models work and how they can be used to understand future climate hazards, including Climate modelling ‒ an overview and A closer look at climate modelling.
The Bureau of Meteorology provides access to historical climate data in a variety of formats, including timeseries charts and data for states and regions.
Sea level rise and marine heatwaves
Show more- CoastAdapt provides a variety of tools to understand coastal hazards and adaptation options, including sea level projections and maps for local government areas. Where available, there are maps for two future emissions scenarios (RCP4.5 and RCP8.5) for 2050 and 2100. CoastAdapt also provides educational information on climate-driven coastal hazards and important considerations for risk assessments and adaptation planning. For example, the Coastal Climate Adaptation Decision Support tool (C-CADS) leads users through a six-step process to support effective adaptation decisions.
- Coastal Risk Australia provides more coverage and flexibility in the map displays. In addition to viewing sea levels projections for different scenarios, you can manually set the level (in 10 cm increments up to 10 m) to display on the map. This is useful for exploring the implications of low-likelihood scenarios with higher impact levels (e.g. based on the higher range or longer-term information in the latest IPCC report), decision trigger points, etc.
- Canute 3 (CSIRO) is a sea level calculator that provides estimates of the likelihood of extreme sea levels during this century, accounting for climate-related sea level rise as well as the effects of tides, storm surges and wave setup. A related fact sheet is also available.
- In August 2024, the updated Climate Change Considerations chapter of Australian Rainfall and Runoff: A Guide to Flood Estimation (ARR) was released following an 18 month development, review and consultation process. The update was delivered by the Department of Climate Change, Energy, the Environment and Water in partnership with Engineers Australia and incorporates the latest peer-reviewed climate change science.
- The National Aeronautics and Space Administration (NASA) Sea Level Change portal contains training resources, assessment tools and a sea level projection tool suitable for high-level applications.
- CSIRO marine and climate change scientists examined the impact of the 2011 Ningaloo marine heatwave to estimate future projections and impacts for WA under the Earth Systems and Climate Change Hub Project 5.8: Marine and coastal climate services for extremes. The results are presented in a fact sheet.
- Other WA specific guidance includes the Coastal Hazard risk management and adaptation planning guidelines (2019) and considerations from Main Roads.
Sector-specific resources and tools
Show moreIn addition to the general resources above, there are some designed specifically to meet the needs of users within particular sectors such as energy, agriculture and water. Despite their focus on specific sectors, some of the information provided by these resources may be useful in other sectors or for a broader range of uses.
- Electricity Sector Climate Information (ESCI) provides credible, relevant climate and extreme weather information for assessing climate risks for critical infrastructure in the electricity network.
- My Climate View (formerly known as Climate Services for Agriculture) provides agriculture-relevant historical, seasonal and future climate information tailored for production locations and individual commodities via a simple menu-driven interface.
- The Climate Measurement Standards Initiative (CMSI) provides resources to support the measurement and disclosure of climate-related risks in Australia’s financial sector.
- The Guide to future climate projections for water management in Western Australia is a step-by-step decision support tool for WA's water sector that provides a contemporary framework for selecting and applying climate projections.
- Australian Water Outlook (AWO) provides historical data on water availability, forecast products, and the National Hydrological Projections using the Bureau of Meteorology’s Australian Water Landscape Water Balance model (AWRA-L) to inform water resource management. It also has associated region-specific assessment reports which are useful for mitigation and adaptation projects.
- Australian Rainfall and Runoff: A Guide to Flood Estimation is a project jointly led by the Department of Climate Change, Energy, the Environment and Water (DCCEEW) and Engineers Australia. This is a living document summarising the current understanding of the impact of climate change on design flood estimation in an Australian context.
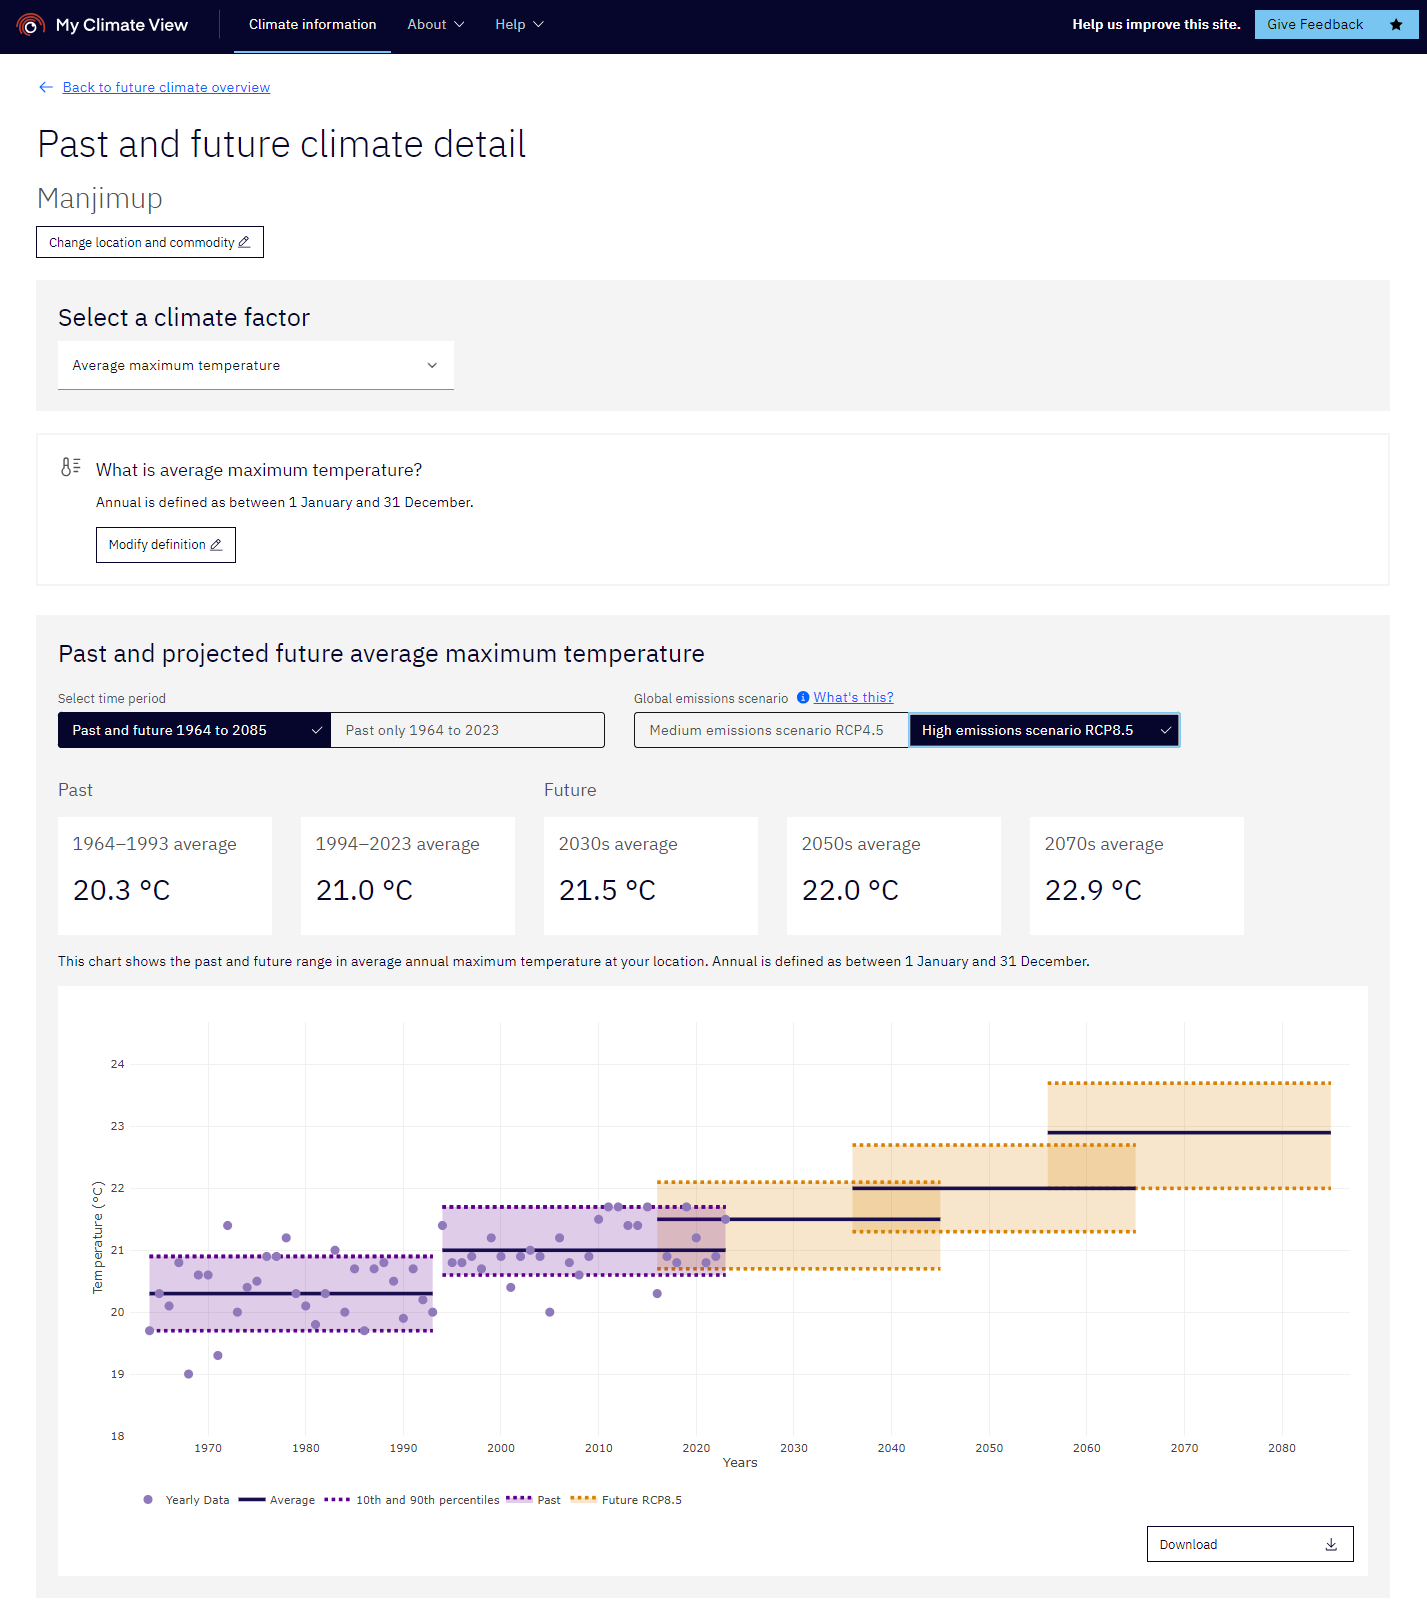
My Climate View provides summary data and visualisations that combine historical data and projections for selected locations and agriculture-relevant climate variables.
International resources
Show moreThe Sixth Assessment Report (AR6) from the Intergovernmental Panel on Climate Change (IPCC) provides the most comprehensive overview of international climate science and interprets the results to support risk assessments and decision-making. Estimates of likelihood and confidence are provided in the conclusions. The assessment reports are released in sections addressing specific topics:
- the physical science
- impacts, adaptation and vulnerability
- mitigation of climate change
- a synthesis report
The IPCC also produces a series of special reports addressing particular topics, such as climate change and land and the impacts of global warming above 1.5°C. The IPCC provides a useful AR6 Synthesis report and a Climate Change 2021: Summary for All on the science of climate change.
The IPCC have produced a Good Practice Guidance Paper on Assessing and Combining Multi Model Climate Projections. This is a useful resource if you are planning to assess or conduct a scientific comparison of different sets of climate projections and is intended as a guide for scientists using results from model intercomparison projects.
The IPCC are currently in the seventh assessment cycle (AR7), which will include additional reports such as:
- Special Report on Climate Change and Cities (expected March 2027)
- Methodology Report on Inventories for Short-lived Climate Forcers (expected December 2027)
- Methodology Report on Carbon Dioxide Removal Technologies (expected December 2027)
- Climate Change: The Physical Science Basis report (expected May 2028)
More information on current and upcoming IPCC reports is available on the IPCC reports page.
Some common uses for climate data
Show moreClimate data and information can be used in a variety of ways that require different levels of detail, formats and ease of use. Some common uses are described below.
General understanding
Many people start exploring climate change information out of curiosity or self-education, or to improve their awareness of possible future hazards and impacts. Others are seeking simple but trustworthy information that can be used in documents like educational reports, communication materials, presentations, briefs and regional profiles. Simple summary tables and charts can often meet these needs.
Physical climate risk assessments
Climate risk assessments vary in the level of detail required and are often performed in sequence, getting more focused and detailed at each step. The Department of Water and Environmental Regulation recognises two levels of risk assessment:
- First pass risk assessment: a high-level assessment to identify physical climate risks that have the potential to impact an entity’s ability to meet strategic objectives and to develop a strategic climate risk management plan. Results can be used to prioritise further work or scope for more detailed assessments. The Climate change risk management guide for WA provides step-by-step guidance for first pass risk assessments.
- Detailed risk assessment: a climate risk assessment focusing on specific projects, including operational planning and major investment decisions. This level of assessment can be used to underpin adaptation planning and implementation plans for which more detailed knowledge, data and information are required.
Detailed hazard analysis
The quantification of climate hazards to enable estimates of exposure and vulnerability can require more detailed information on extreme events under climate change; e.g. projected changes in the frequency, duration and intensity of events relating to extreme heat, rainfall, wind and fire weather. Hazard-specific resources can often provide this kind of information in a variety of formats.
Research and modelling
Researchers and modellers are likely to seek high-resolution climate projection data at fine timescales and for specific models or applications including hydrological modelling, bioclimatic modelling (such as species distribution modelling) and engineering applications (such as analyses to support minimum design specifications or standards for heat or wind).
Strategic policy and planning
Large organisations, including all levels of government, non-government organisations and the private sector, will seek information on the potential changes to climate hazards and risks over strategic timeframes to inform the development of ‒ or amendments to ‒ policies, regulations, governance structures, decision-making frameworks, operations and procedures that adequately consider the effects of climate change.
Reporting and compliance
Public and private organisations need specific information to demonstrate the assessment and management of climate risks. This is being driven by emerging standards for reporting on environmental, social and governance (ESG) performance and financial disclosures of exposure to climate risk based on recommendations of the Task Force on Climate-related Financial Disclosures (TCFD).
Disclaimer
Show moreThis information has been published by the Department of Water and Environmental Regulation as guidance only and does not represent government policy. Any representation, statement, opinion or advice expressed or implied in this publication is made in good faith and on the basis that the Department of Water and Environmental Regulation and its employees are not liable for any damage or loss whatsoever which may occur as a result of action taken or not taken, as the case may be in respect of any representation, statement, opinion or advice referred to herein. Professional advice should be obtained before applying the information contained in this document to particular circumstances.